
The second instalment of the Serco Institute’s series, People Powered Public Services, has found that Australians are marginally more satisfied with public services than they were when we undertook polling for the first report, published in October 2021. This Australia-focussed version of the report follows the recent publication of its UK equivalent, which you can find here.
This research project sees the Serco Institute track public sentiment over time towards 15 different public services in Australia and in the UK, as well as a further two areas: Public Services as a Whole and Management of Covid-19. This is done through a series of nationally representative surveys carried out regularly by an independent polling company.
At the time that polling for this report was undertaken between 20-24 January 2022, Australia was experiencing a record-breaking wave of Covid-19, brought on by the Omicron variant. Daily Covid case numbers reached a peak of over 120,000 by mid-January, only to decline in the days and weeks afterwards[1]. With as many as half a million Australians thought to have contracted the coronavirus during the ‘Omicron summer’, Australia has faced issues with testing, as well food rationing at some supermarkets and rising hospitalisations, all against the backdrop of a federal election scheduled for May[2]. Floods in New South Wales and Queensland and the outbreak of war in Ukraine further complicated Australia’s public discourse, although both of these terrible events occurred after the fieldwork for this study was undertaken[3].
In this context, the Institute was able to observe some interesting trends in shifting public opinion in connection to a wide range of public services, ranging from Hospital Services to Immigration & Asylum.
 The big picture continued
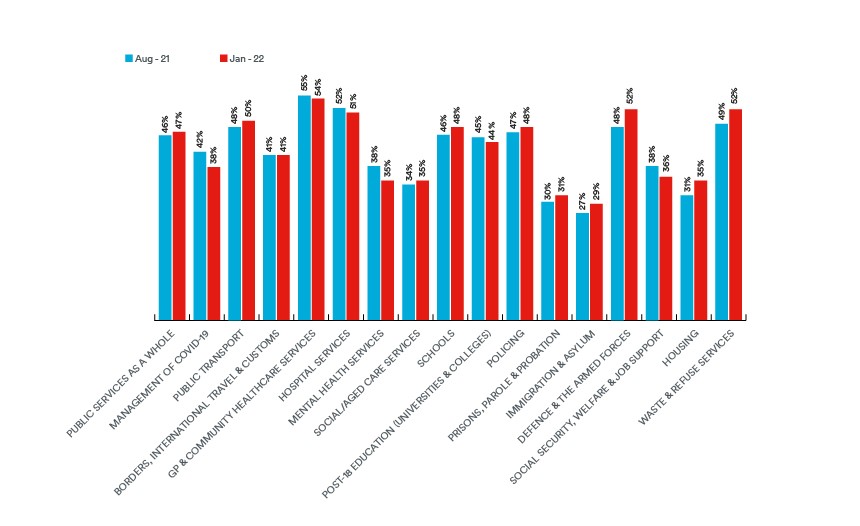
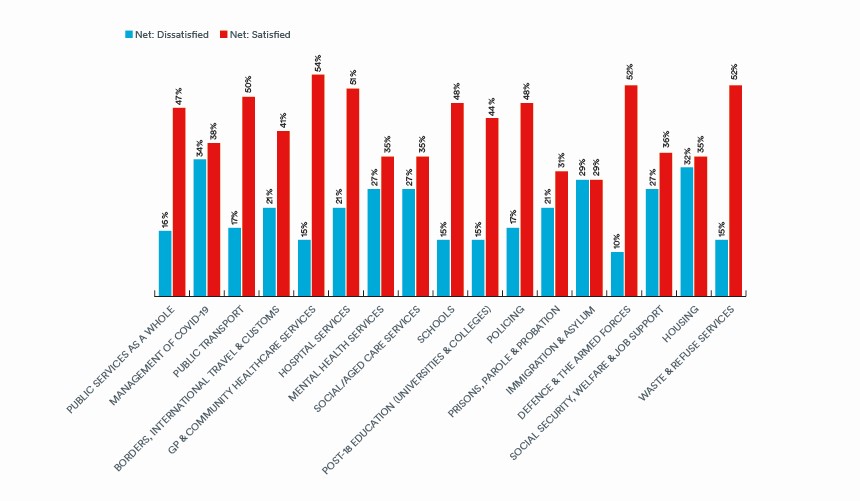
47% of Australians were ‘very’ or ‘quite’ satisfied (the net satisfaction score) with Public Services as a Whole – this was almost three times the number of Australians who said they were ‘very’ or ‘quite’ dissatisfied (16%) with the general state of public services, and virtually unchanged from our previous report, where satisfaction with Public Satisfaction as a Whole had stood just one point lower at 46%.
11 of the 17 surveyed areas of public services saw the same or higher levels of public satisfaction relative to our October report. GP & Community Healthcare Services remained, as before, the most highly rated category, with 54% of Australians satisfied and just 15% dissatisfied with this public service. Other public services with which Australians were most satisfied were Defence & the Armed Forces (52% net satisfaction, 10% net dissatisfaction), Waste & Refuse Services (52% net satisfaction, 15% net dissatisfaction) and Hospital Services (51% net satisfaction, 21% net dissatisfaction).
Many of the variances in sentiment along demographic, geographic and socioeconomic lines which we observed in the first instalment in the series continued to hold true in our new round of polling.
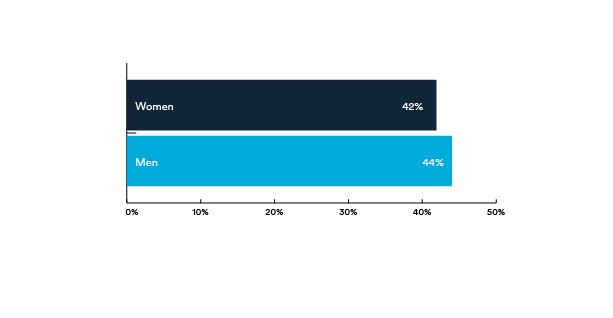
As was the case in our last round of polling, Australian women were, in aggregate, less satisfied than their male counterparts, consistently returning lower satisfaction scores than men. In all but one case, however, the differentials between men’s and women’s satisfaction did not exceed four percentage points: the only exception was in connection to Prisons, Parole & Probation, where men, at 33%, were seven points more likely to be satisfied than women (26%). However, notably, while men’s (mean) average satisfaction score across the 17 polled areas remained stable at 44%, the corresponding figure for women had risen one point to 42%, representing a narrowing of the overall gap in satisfaction between men and women.
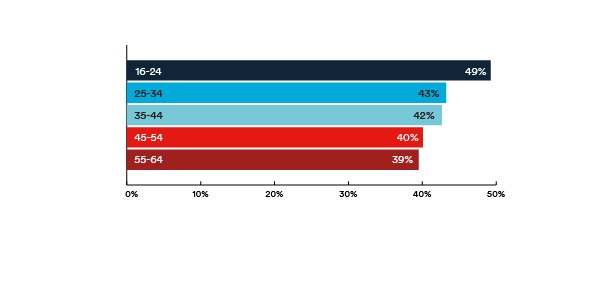
Older respondents remained less satisfied with public services than those in younger age groups: the oldest age cohort, those aged 55-64, generally returned lower satisfaction scores than those in younger age bandings. 16-24-year-olds registered a four-point improvement in their average satisfaction score across all polled areas (49%) relative to our previous survey, drawing ahead of the next-most satisfied age group, those aged 25-34.
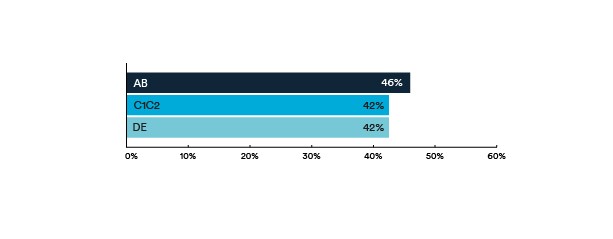
Once again, a respondent’s socioeconomic status remained a good predictor of their satisfaction with public services. Those belonging to ‘higher’ AB social grades[4], or those in managerial or professional occupations, were more satisfied with public services than those belonging to the C1C2 and DE social grades: AB respondents comprised the most satisfied socioeconomic group in 12 out of 17 polled categories. However, the direction of travel varied among the social cohorts. For instance, DE respondents recorded higher satisfaction scores across 15 of the 17 surveyed areas, resulting in a five-percentage-point improvement to their average satisfaction score (42%). By contrast, those belonging to the C1C2 grouping indicated lower satisfaction levels across 11 categories, resulting in a two-point drop in their average satisfaction score to 42%, bringing them level with the DE social group.
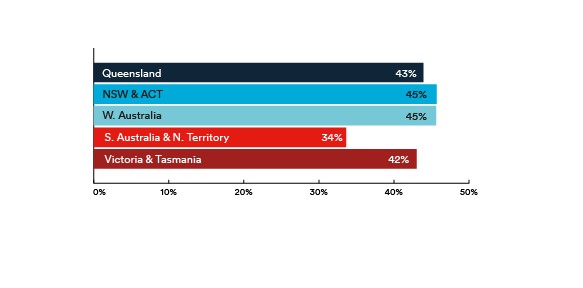
Australia’s states and territories once again demonstrated significantly different levels of satisfaction and dissatisfaction with various public services. South Australia & the Northern Territory replaced Victoria & Tasmania as the country’s least satisfied region, returning the lowest average satisfaction score (34%) across the 17 polled areas by some margin. Western Australia tied with New South Wales & the Australian Capital Territory for the highest average satisfaction score (both 45%), with the latter region returning satisfaction ratings at or above the Australia-wide average across all 17 surveyed categories. However, small sample sizes for Western Australia and for South Australia & the Northern Territory mean that data regarding these two polling regions should be viewed with caution.
We posit that the Omicron wave which swept Australia in late 2021 and early 2022 is likely to have significantly impacted popular sentiment towards public services in the country. This is demonstrated most evidently in the decline in satisfaction with Management of Covid-19: 38% of respondents indicated they were satisfied with Australia’s handling of Covid-19, down four points from our previous survey. Furthermore, dissatisfaction with Management of Covid-19 rose seven points, from 27% to 34%, meaning Australians were only four points more likely to be satisfied with their country’s management of the pandemic than they were to be dissatisfied. The ‘Omicron effect’ is also potentially responsible for other, more granular shifts in opinion: for instance, although overall satisfaction with Social/Aged Care Services rose one percentage point to 35%, among members of the oldest age group, 55-64-year-olds, satisfaction fell six points, from 27% to 21%. As this group is most likely to need these services, they are by extension most likely to have been impacted by the Omicron-wrought staffing shortages in the Australian aged care sector[5].
In other polled areas, however, it is more likely that Australians simply approve of public policy decisions taken in recent months. Satisfaction with Immigration & Asylum, for example, rose two points to 29%. While this is the lowest satisfaction score among the 17 surveyed categories of public services, perhaps this marginal improvement in satisfaction signals quiet approval among members of the Australian public for the Commonwealth Government’s decision in November 2021 to begin easing entry restrictions for fully vaccinated holders of student and skilled migrant visas for the first time since the beginning of the pandemic[6]. As another example, Defence & the Armed Forces saw public satisfaction rise four points from 48% to 52%, in what may be tacit support for the trilateral AUKUS military partnership, announced in September 2021, between Australia, Britain and the United States[7].
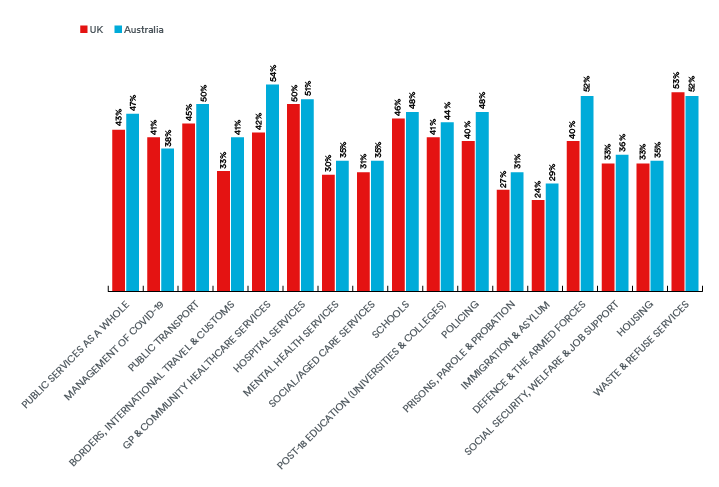
As before, an identical study was carried out in the UK. A comparison of the two new rounds of polling in each of the countries reveals that, much as in our first report, Australians remained more satisfied with public services than respondents in the UK.
Of the 17 categories of public services we polled, Australians returned higher satisfaction scores on 15 occasions, up from 14 in our earlier survey. Only in regard to Management of Covid-19 (38% in Australia; 41% satisfied in the UK) and Waste & Refuse Service (52% in Australia; 53% satisfied in the UK) did Britons return higher satisfaction scores than their Antipodean counterparts. This difference was further underscored by the (mean) average satisfaction scores across the 17 polled categories: this figure in the UK, 38%, was five points below the corresponding figure for Australia (43%). The gap in average satisfaction had furthermore widened since our previous round of polling, from three to five points.
This does not, however, necessarily speak to the superiority of Australia’s public services relative to the UK’s. Australians could have different expectations of their public services from Britons or be better-disposed towards them due to a more easy-going national psyche. Or perhaps British survey takers’ lower satisfaction with public services is due to the comparatively bleaker economic outlook in Britain: while inflation in Australia is expected to reach a 14-year high of 5% by mid-2022[8], inflation in the UK is estimated to peak in spring 2022 at 8.3% or possibly even exceed 8.4%, a rate last seen in April 1991[9]. Perhaps the greater hit to British living standards has resulted in UK respondents being less well-disposed towards public services in their country.
While government is not just about pleasing everyone, in the future, the most successful governments will need to stay closer to their citizens, building a better two-way dialogue focussed on how to improve services and overcome newly emerging challenges. Central to this, is the idea of citizen-centred design of public services – creating services from the ground up, starting with the needs of the user, rather than what is convenient for the provider.
This series from the Serco Institute – ‘People Powered Public Services: Monitoring Australian Opinion’ – aims to make a small contribution to this new emerging era of public service design and delivery.
[1] ‘After the peak: What’s in store for Australia now that the Omicron wave has turned?’ – ABC News.
[3] ‘Floods, a PM with COVID and a war in Ukraine have up-ended Australia’s election campaign plan’ – ABC News.
[5] ‘Aged care providers beg Scott Morrison to send in military – “We’d welcome any help”’ – The Guardian.
[6] ‘Sydney, Melbourne to reap benefits from return of international students, skilled workers’ – The Sydney Morning Herald.