
In the second instalment of the Serco Institute’s series, People Powered Public Services, we found that the British public, despite being largely happy with public services, were marginally less satisfied overall than they had been in the first instalment of the series, published in October 2021.
This research project sees the Serco Institute track public sentiment over time towards 15 different public services in the UK and in Australia, as well as a further two areas: Public Services as a Whole and Management of Covid-19. This is done through a series of nationally representative surveys carried out regularly by an independent polling company.
Polling for this latest report was conducted in late January, as British public life was undergoing some significant changes: a record-breaking wave of Covid-19 brought about by the Omicron variant was receding, and with it many of England’s Covid restrictions (Scotland, Wales and Northern Ireland’s restrictions being removed slightly later); inflation and looming tax rises dominated the fiscal debate; and, on Europe’s eastern flanks, over 150,000 Russian troops were massed on the border with Ukraine, although this had not yet bubbled over into conflict.
Taking into account these changing conditions, we observed some interesting patterns in the sentiments of British citizens towards a wide range of public services, from GP & Community Healthcare Services to Defence & the Armed Forces.
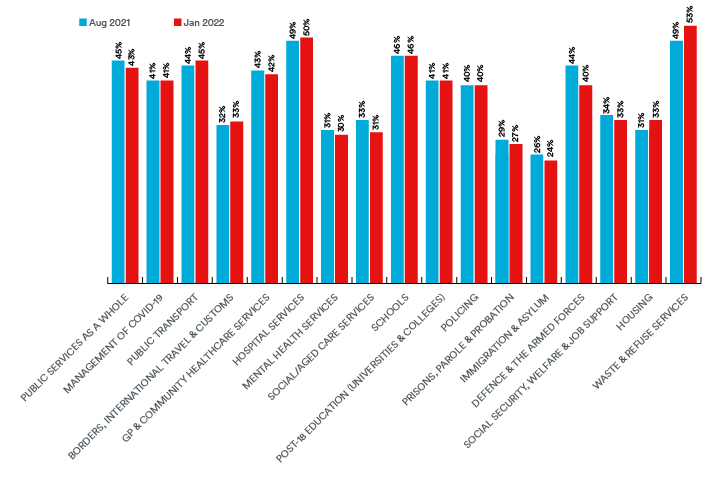
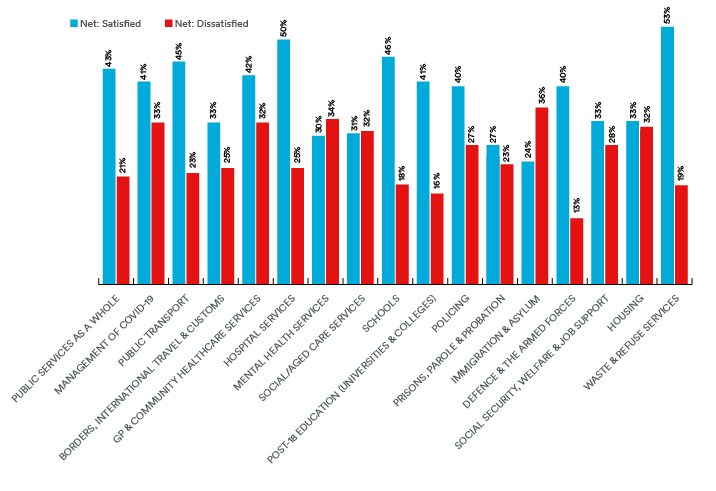
43% of Britons reported they were ‘very’ or ‘quite’ satisfied (the net satisfaction score) with Public Services as a Whole, down just two points from the first report in the series. 21% indicated they were ‘very’ or ‘quite’ dissatisfied (the net dissatisfaction score) with Public Services as a Whole, meaning respondents were twice as likely to be satisfied than dissatisfied with the general state of public services in the UK.
Nine of the 17 surveyed areas of public services saw satisfaction levels higher than or unchanged from those recorded in our previous report. The public service deemed most satisfactory by the British citizenry was Waste & Refuse Service, with 53% of respondents net satisfied and 19% net dissatisfied. Other services with which UK residents were most satisfied were Hospital Services (50% net satisfaction, 25% net dissatisfaction), Schools (46% net satisfaction, 18% net dissatisfaction) and Public Transport (45% net satisfaction, 23% net dissatisfaction).
Many of the differences in sentiment among respondents of varying demographic, socioeconomic and geographic backgrounds which we identified in our previous report remained visible from the survey data from our newest round of polling.
Women continued to give satisfaction scores consistently lower than those of men: when asked about Public Services as a Whole, for instance, 46% of men indicated they were satisfied, compared to 39% of women. The differentials between men and women’s satisfaction were in some cases quite significant: for instance, while only 32% of men were satisfied with Immigration & Asylum, this was double the proportion of satisfied women (16%). The consistency of women’s lower satisfaction scores suggests that there remains a gender-based inequity in UK public services which should be studied in greater detail and, if necessary, rectified.

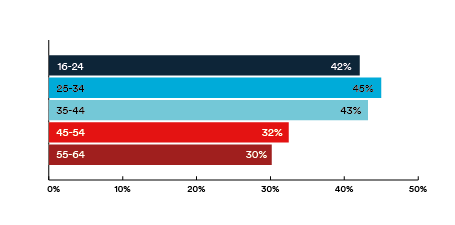
It remained true that older people were less likely to be satisfied, and more likely to be dissatisfied, than younger people. However, whereas in our previous survey, respondents belonging to the middle age bandings (25-34 and 35-44) consistently gave higher satisfaction scores than those in the youngest (16-24) and oldest (55-64) age cohorts, with this round of polling there was evidence that 16-24-year-olds were closing the gap, registering improved satisfaction levels across 14 of the 17 polled areas. The youngest age group’s (mean) average satisfaction score increased from 38% in our first report to 42% in our second.
Socioeconomic status remained a reliable indicator of an individual’s reported satisfaction with public services, and, as previously, those belonging to ‘higher’ AB social grades[1], or those in managerial or professional positions, were more likely to be satisfied with public services than those in the C1C2 and DE social grades. However, our survey data suggested that the gap may be narrowing, with respondents in the AB social cohort recording declines in satisfaction across all 17 polled categories while those in the DE grouping registered improved satisfaction across all but one of the surveyed service areas.

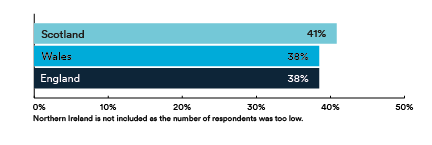
Once again, the UK’s nations diverged significantly from one another in their opinion of public services. Scotland, however, took the place of Wales as the most satisfied nation, returning satisfaction scores equal to or above the UK average across 11 of 17 surveyed areas: this was in sharp contrast to our previous polling, where Scottish respondents generally returned below-average satisfaction scores. However, small sample sizes for both Scotland and Wales mean data regarding these nations should be regarded with some caution.
We posit that the abovementioned changing economic conditions in the UK are at least in part responsible for some of the shifts we identified in public opinion. For instance, in October 2021 the Chancellor announced a slew of fiscal measures, including a rise in National Insurance and income tax, as well as an increase in the National Living Wage and changes to the Universal Credit taper rate: these are expected to deliver, by the mid-2020s, an income boost of around 2.8% to lower-earning households but a 3.1% cut to the incomes of higher-earning households[2]. This could explain why satisfaction with Social Security, Welfare & Job Support rose six percentage points among respondents in the DE socioeconomic bracket, but fell by five points among those belonging to the AB bracket.
The Omicron wave of late 2021 and early 2022 will likely have had some impact on Britons’ sentiments towards public services. Most obviously, while net satisfaction with Management of Covid-19 remained stable at 41%, net dissatisfaction rose four points to 33%. The latest, and biggest, Covid wave also placed many public services in the UK under considerable strain, and this may have been reflected in our survey data. For instance, 16-24-year-olds were the only age group to indicate an increased level of satisfaction with Social/Aged Care Services relative to our previous report: as they are much less likely than older age groups to need these services, they are by extension much less likely to have been impacted by disruptions in care services due to staffing shortages in the social care sector as a consequence of the Omicron variant[3].
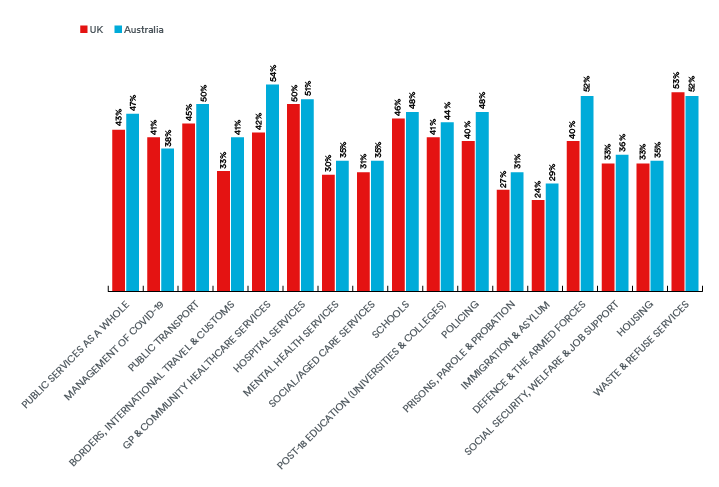
As before, an identical study was carried out in Australia. A comparison of the two new rounds of polling in each of the countries reveals that, much as in our first report, Australians remained more satisfied with public services than respondents in the UK.
Of the 17 categories of public services we polled, Australians returned higher satisfaction scores on 15 occasions, up from 14 in our earlier survey. Only in regard to Management of Covid-19 (41% satisfied in the UK; 38% in Australia) and Waste & Refuse Service (53% satisfied in the UK; 52% in Australia) did Britons return higher satisfaction scores than their Antipodean counterparts. This difference was further underscored by the (mean) average satisfaction scores across the 17 polled categories: this figure in the UK, 38%, was five points below the corresponding figure for Australia (43%). The gap in average satisfaction had furthermore widened since our previous round of polling, from three to five points.
This does not, however, necessarily speak to the superiority of Australia’s public services relative to the UK’s. Australians could have different expectations of their public services from Britons or be better-disposed towards them due to a more easy-going national psyche. However, evidence that there exists a growing gap between British and Australian citizens in their satisfaction with public services should prompt UK policymakers to more closely examine why this may be and whether there may be lessons to learn from Australia.
While government is not just about pleasing everyone, in the future, the most successful governments will need to stay closer to their citizens, building a better two-way dialogue focussed on how to improve services and overcome newly emerging challenges. Central to this, is the idea of citizen-centred design of public services – creating services from the ground up, starting with the needs of the user, rather than what is convenient for the provider.
This series from the Serco Institute – ‘People Powered Public Services: Monitoring UK Opinion’ – aims to make a small contribution to this new emerging era of public service design and delivery.