
Our reliance on many public services has arguably never been brought into starker relief than in the last 18 months. And, according to our ground-breaking new study - People Powered Public Services: Monitoring UK Opinion - all in all the UK public are relatively satisfied with the services that they use.
In this informative new project, we will track public sentiment towards 15 different areas of public service in the UK (and Australia), as well as ‘Public Services as a Whole’ and the ‘Management of Covid-19’. This will be done through a series of nationally representative surveys carried out quarterly by an independent polling company.
This first paper examines the public’s mood as the UK emerges from Covid-19 restrictions and already we can see many interesting patterns[1].
Covering everything from GP & Community Healthcare to Waste & Refuse Services, we sought to get the fullest possible picture of how people feel about public services.
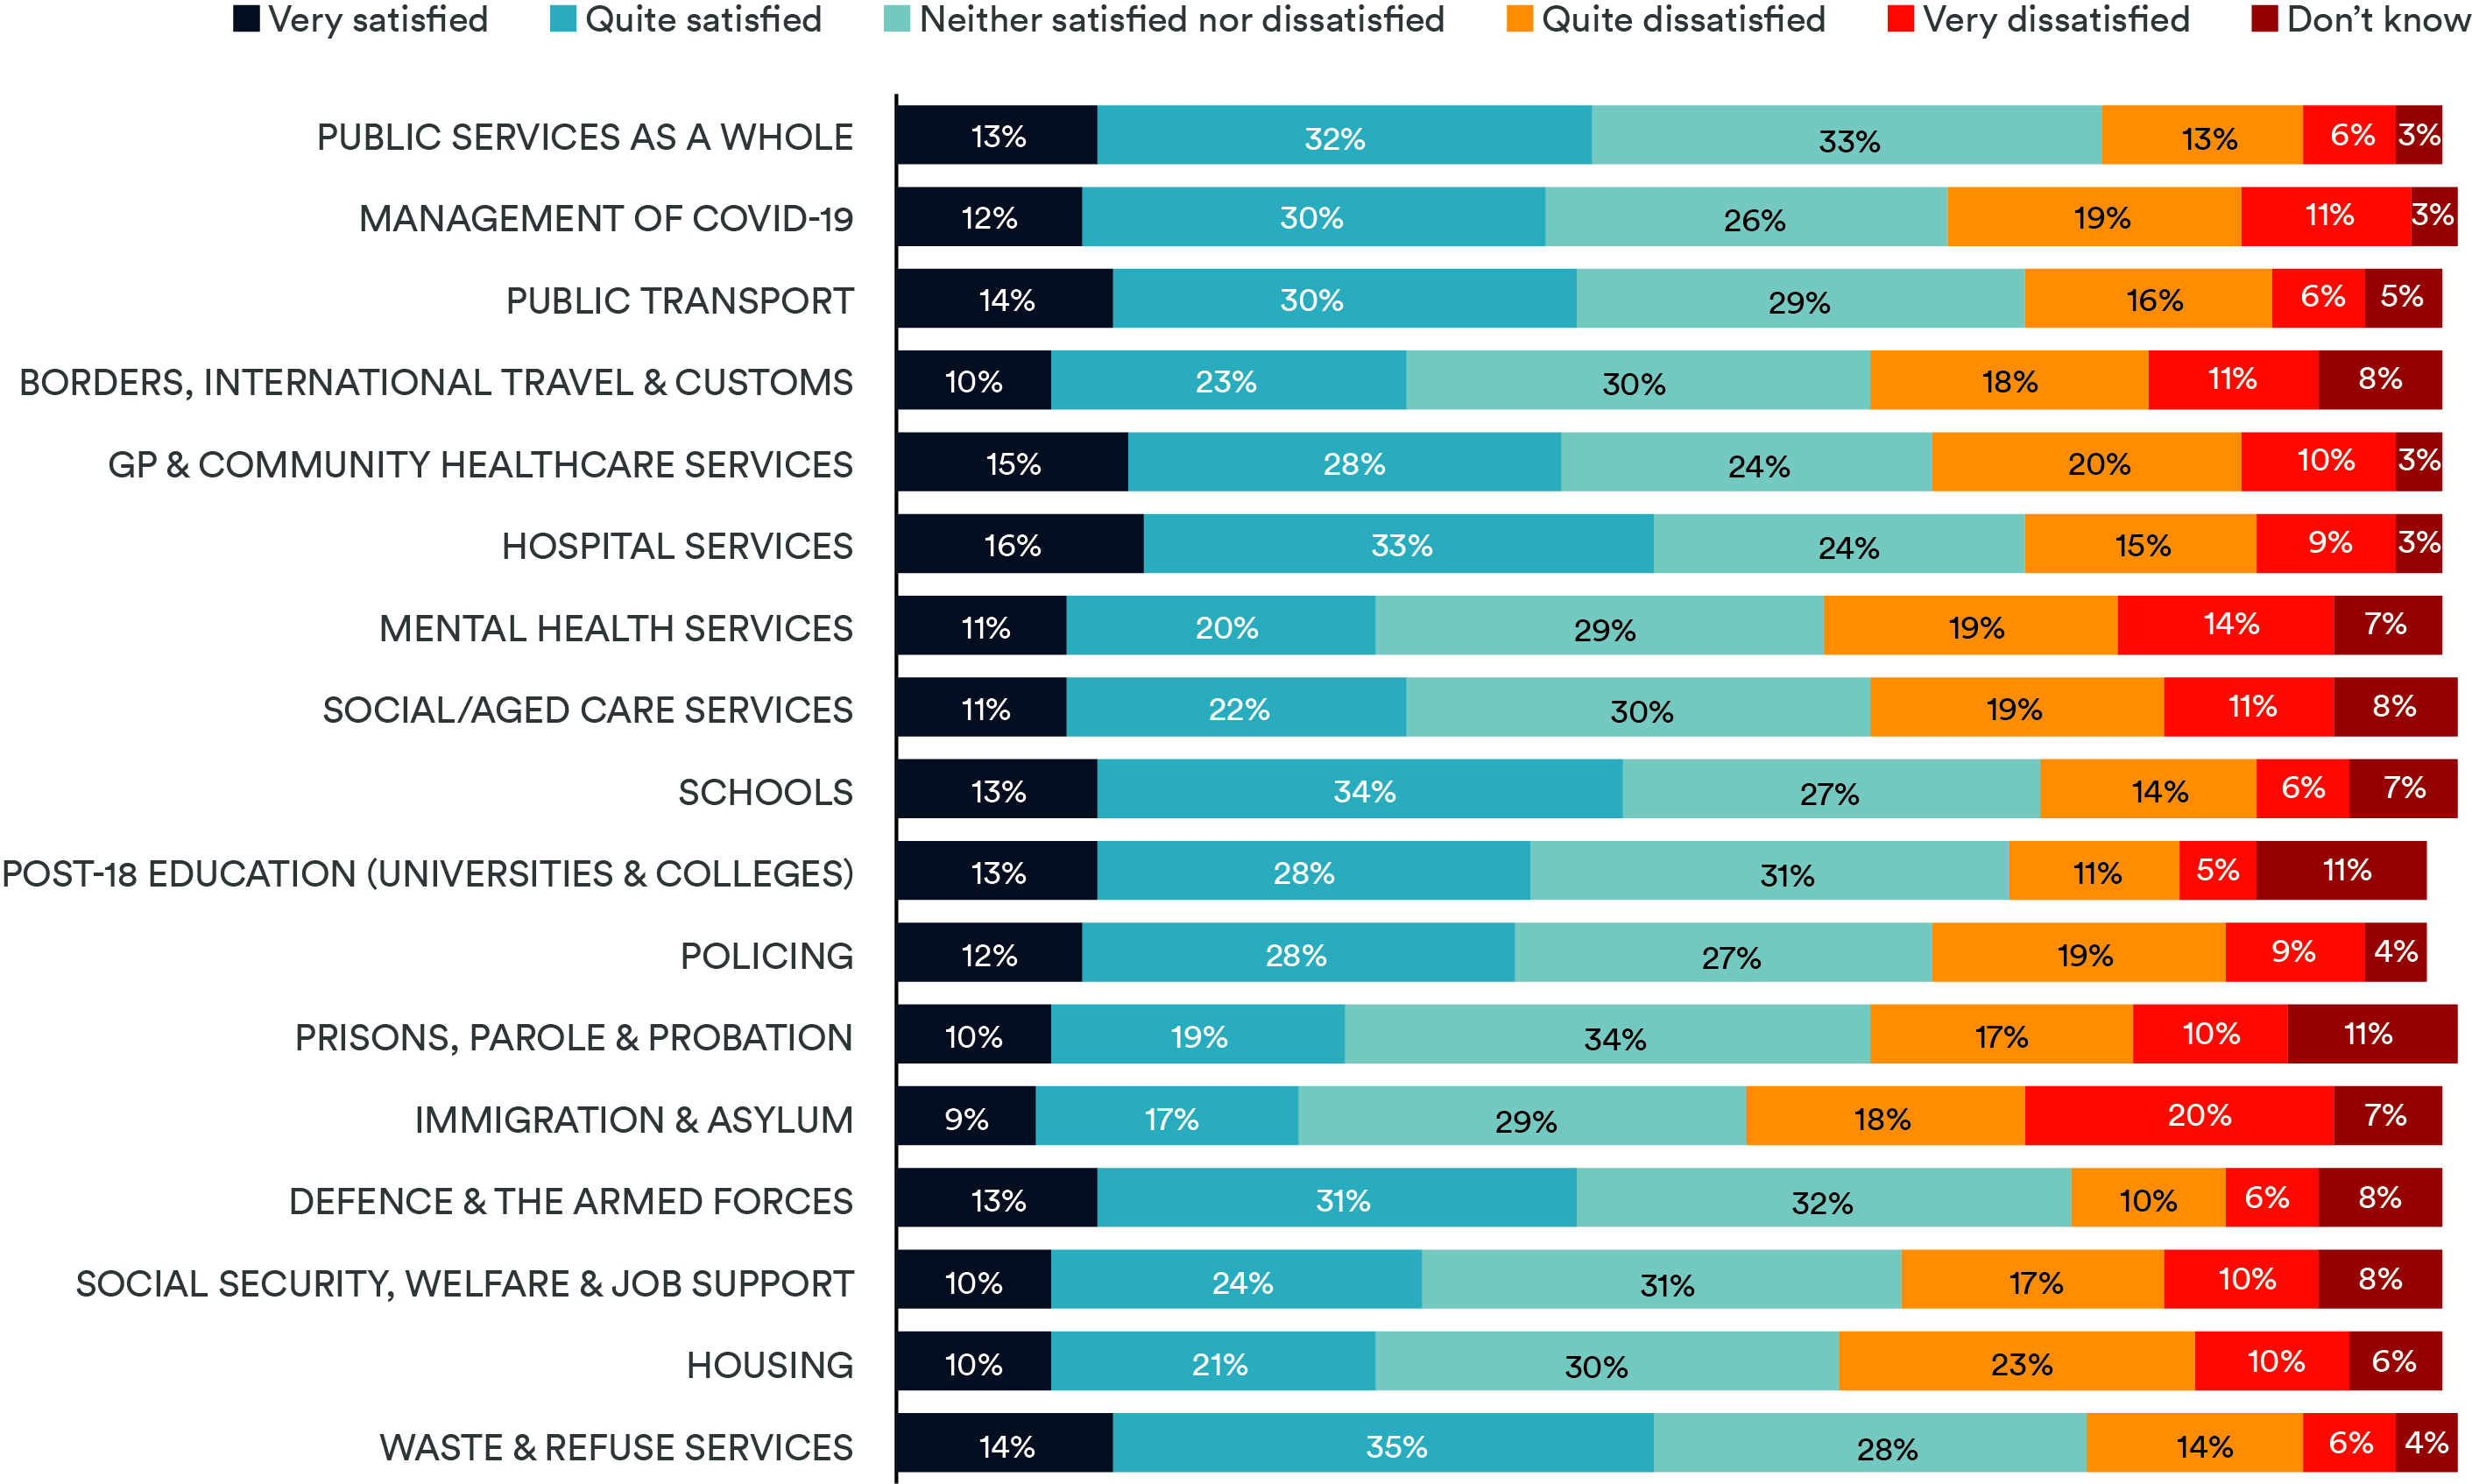
Britons have a generally positive view of public services: when asked to rate Public Services as a Whole, 45% of respondents said they were either ‘very’ or ‘quite satisfied’ (the net satisfaction score), compared to 19% who said they were ‘very’ or ‘quite dissatisfied’ (the net dissatisfaction score), meaning satisfied respondents outnumbered dissatisfied ones by more than two to one. Furthermore, the vast majority of the remainder of the public responded by saying they were ‘neither satisfied nor dissatisfied’ (33%) – arguably indicating that they think that services were performing ‘as expected’.
In fact, the public service with which the citizenry proved most satisfied was Waste & Refuse Services, with a 49% net satisfaction score and a 19% net dissatisfaction score. Excluding Public Services as a Whole, other public services rated highly by respondents include Hospital Services (49% net satisfaction, 24% net dissatisfaction); Schools (46% net satisfaction, 19% net dissatisfaction); Defence & the Armed Forces (44% net satisfaction, 16% net dissatisfaction); and Public Transport (44% net satisfaction, 22% net dissatisfaction).
Across all but three areas we polled, more of the UK public indicated that they were satisfied than dissatisfied.
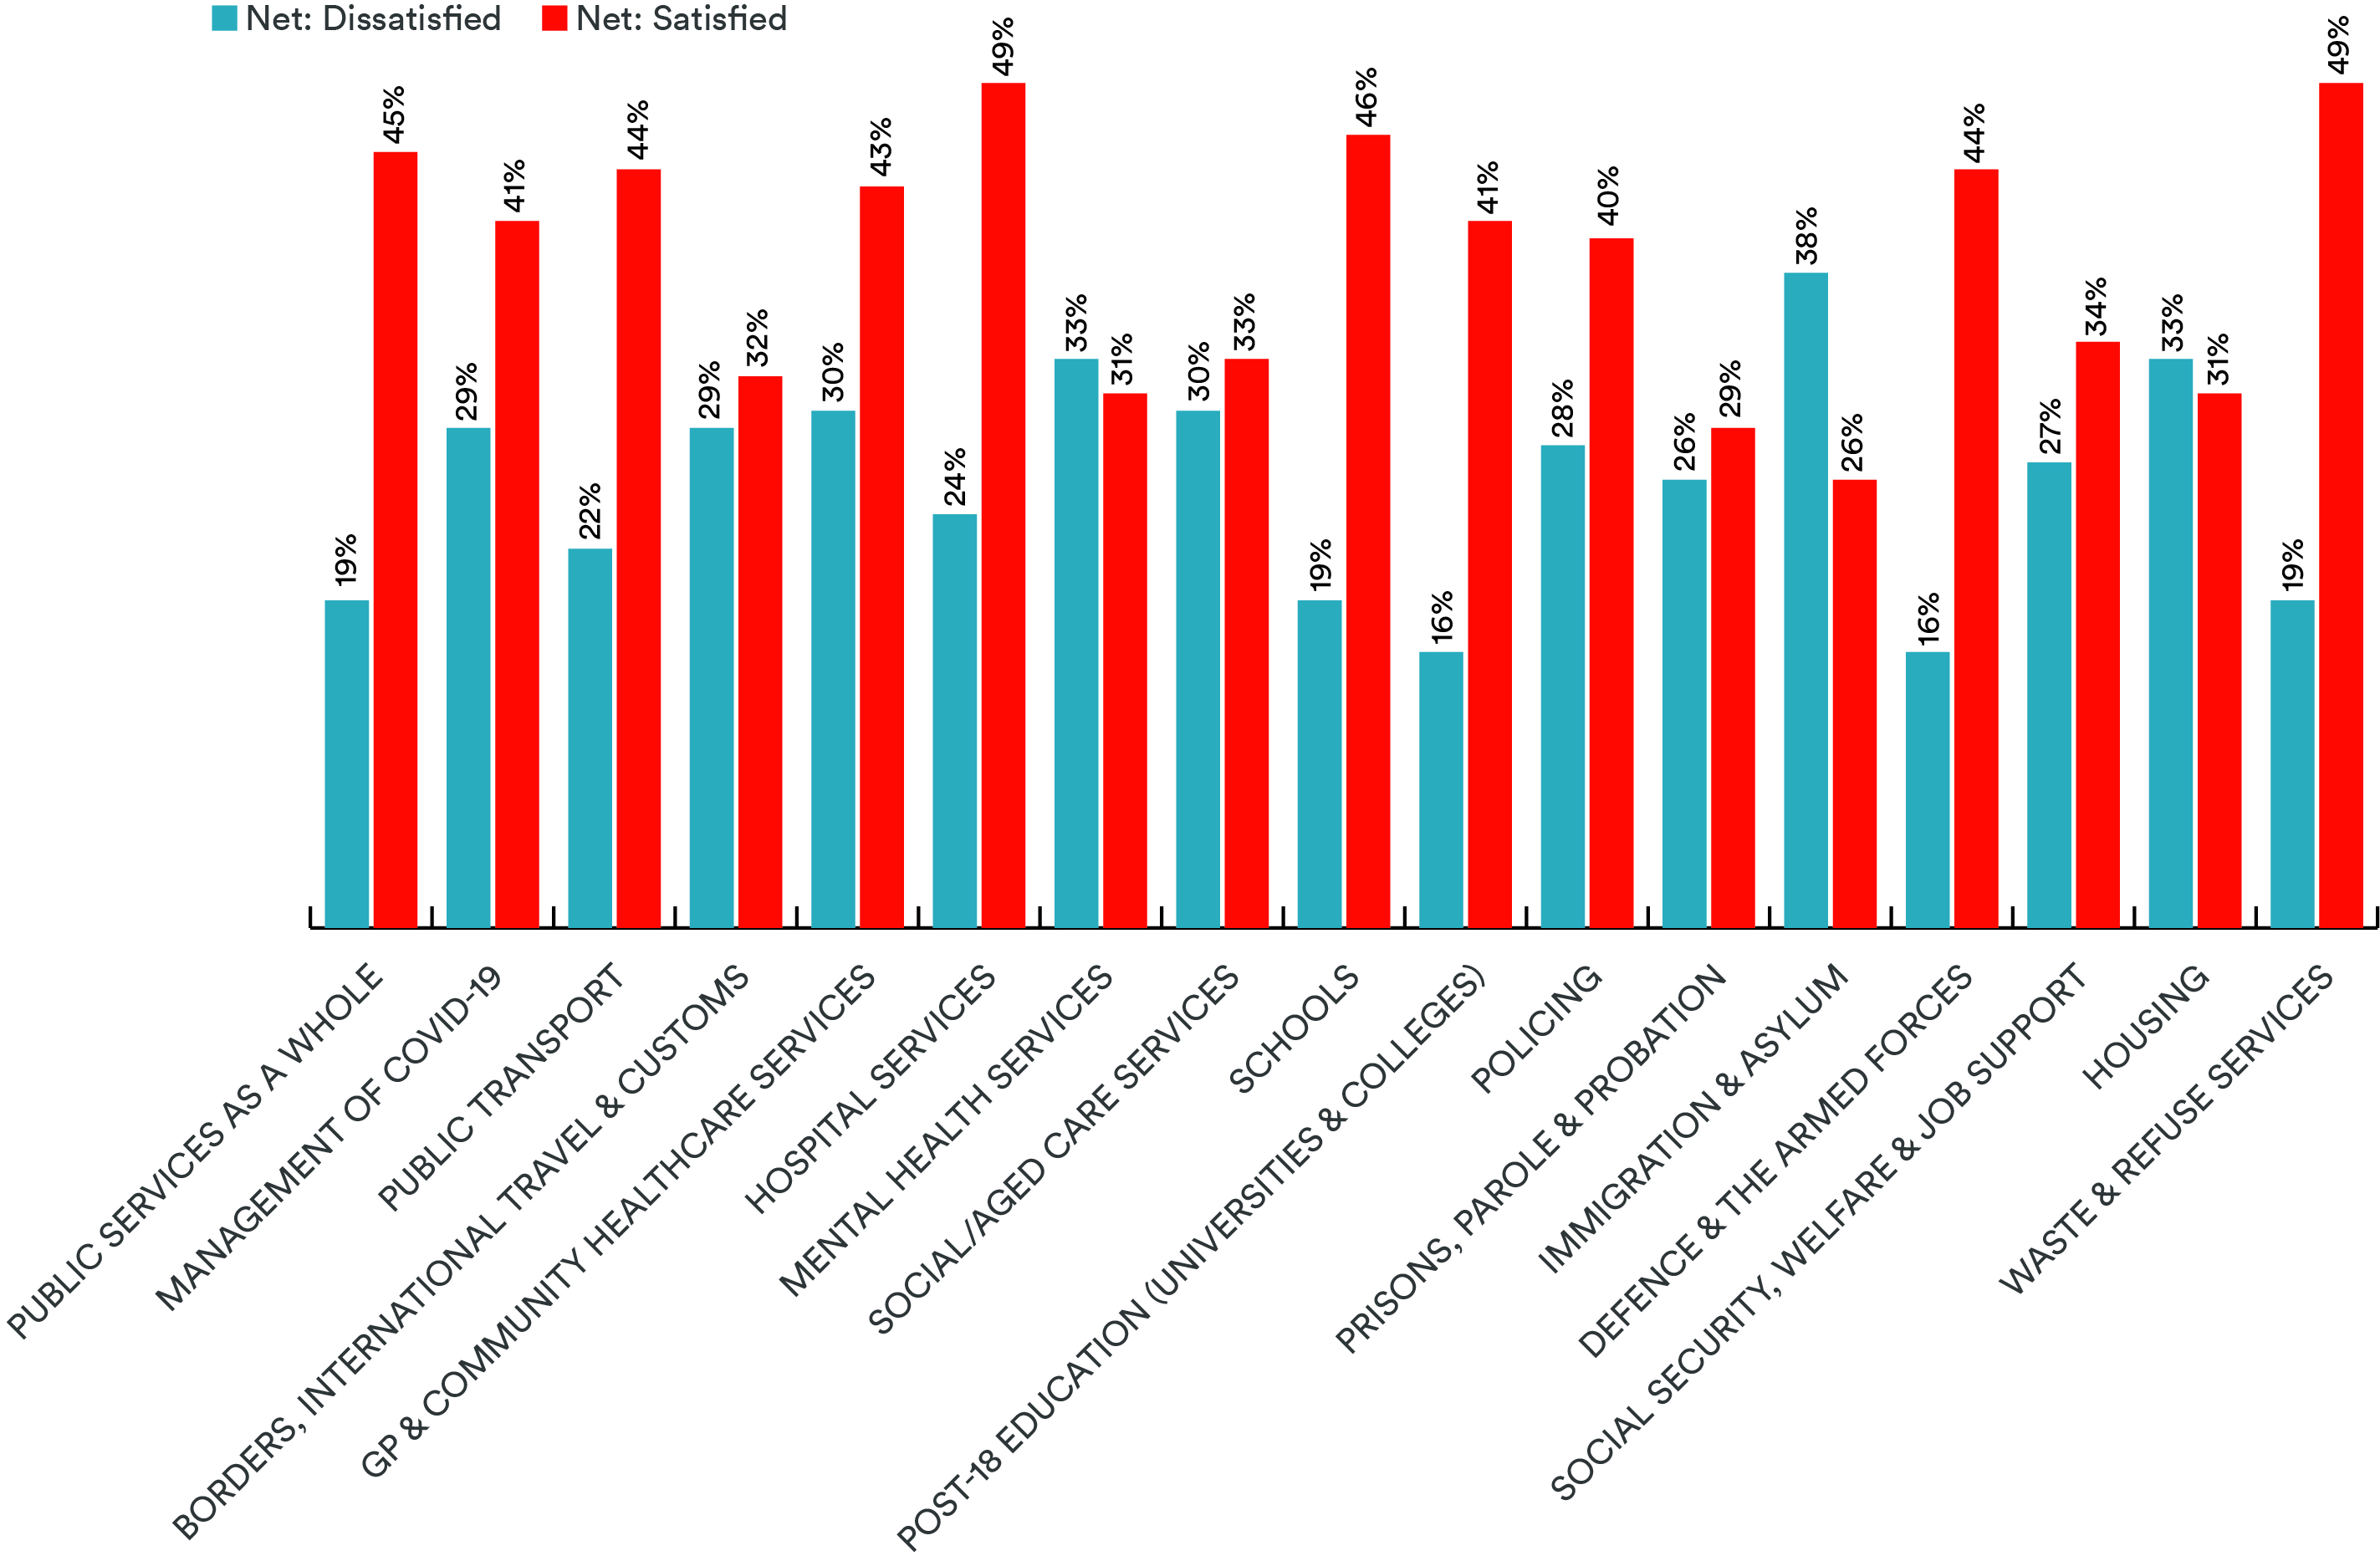
Immigration & Asylum was the public service with which UK citizens were most dissatisfied, registering a 26% net satisfaction score and a 38% net dissatisfaction score. It sits alongside two other areas where a higher proportion of respondents indicated they were dissatisfied than satisfied – Mental Health Services (31% net satisfaction, 33% net dissatisfaction) and Housing (31% net satisfaction, 33% net dissatisfaction).
Although this is only the first in a series of studies, clear trends were already visible in the data, with levels of satisfaction and dissatisfaction varying – sometimes significantly – along demographic, socioeconomic and geographical lines.
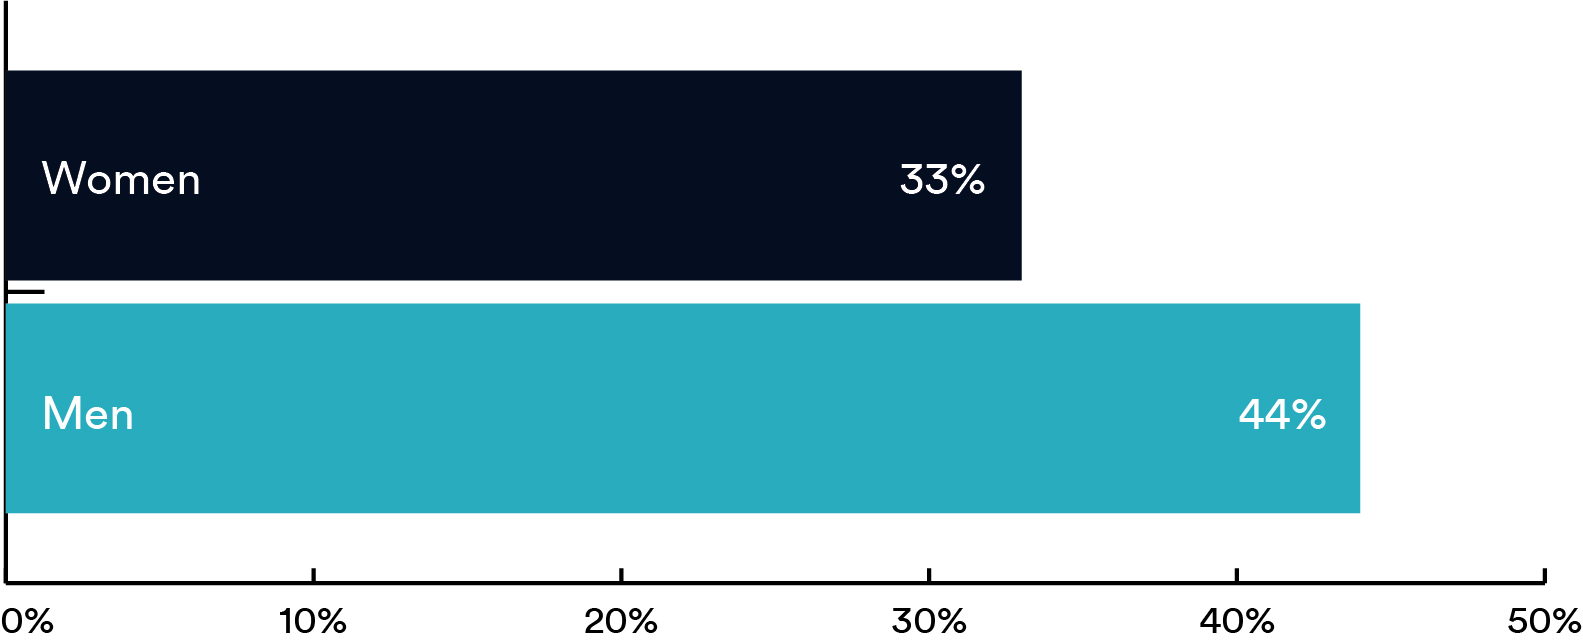
Across all polled areas of public services, women consistently gave lower satisfaction scores relative to men. The gaps between male and female net satisfaction ranged from the relatively negligible (Public Transport: Women 42% / Men 45%) to the substantial (Immigration & Asylum: Women 17% / Men 34%). The consistency of women’s lower satisfaction scores, combined with the margins separating women from men in some areas, suggests a gender inequity in UK public services which should be explored in greater detail.
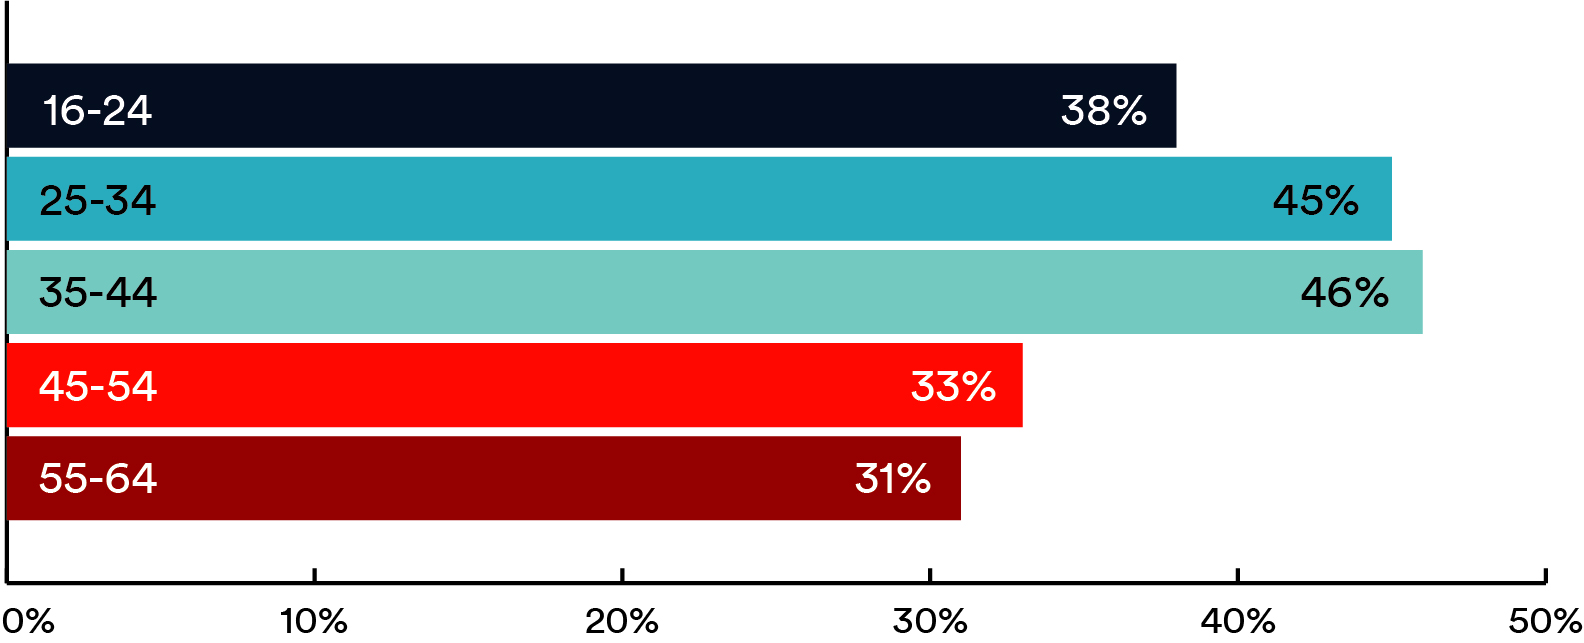
Satisfaction and dissatisfaction differed considerably between the age groups. With a few exceptions, the oldest age cohort (55-64-year-olds) consistently showed lower levels of satisfaction than younger respondents. Furthermore, across the majority of surveyed public services, 55-64-year-old respondents were more dissatisfied than satisfied. By contrast, those in the 25-34 and 35-44 age ranges generally registered the highest satisfaction scores: those in the youngest age banding (16-24-year-olds) and in the older age groups were consistently less satisfied than those in the middle bandings.
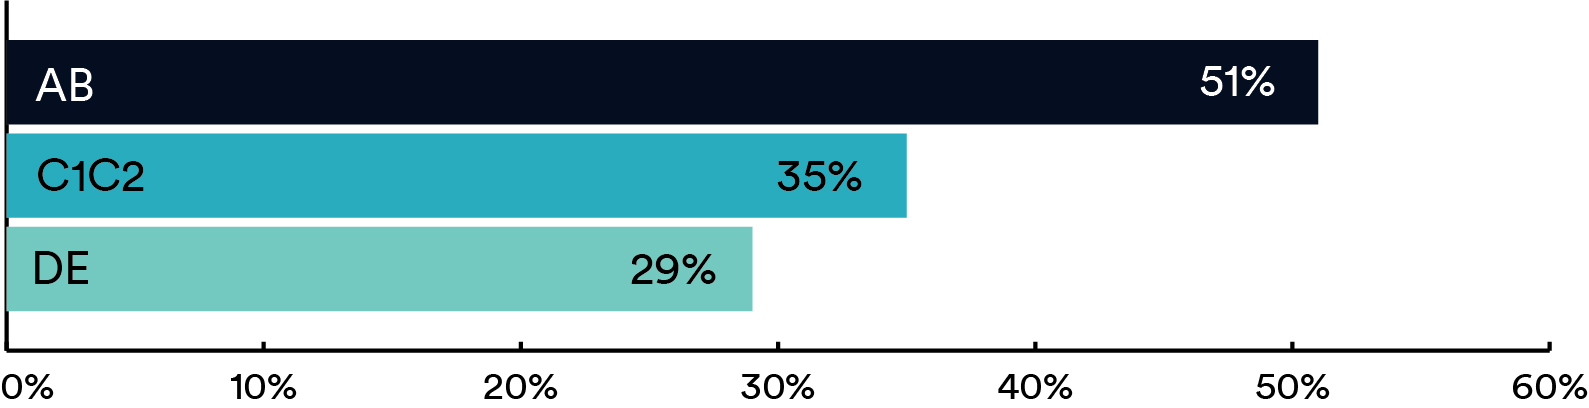
Respondents’ socioeconomic status was a reliable predictor of satisfaction with public services. The survey found that those in higher ‘Social Grades’[2] – professionals and those in senior managerial positions – were more likely to be satisfied with public services, with net satisfaction ratings in this group higher than net dissatisfaction across all polled areas. Those belonging to lower Social Grades returned higher net dissatisfaction scores than net satisfaction across a majority of the surveyed areas of public services.
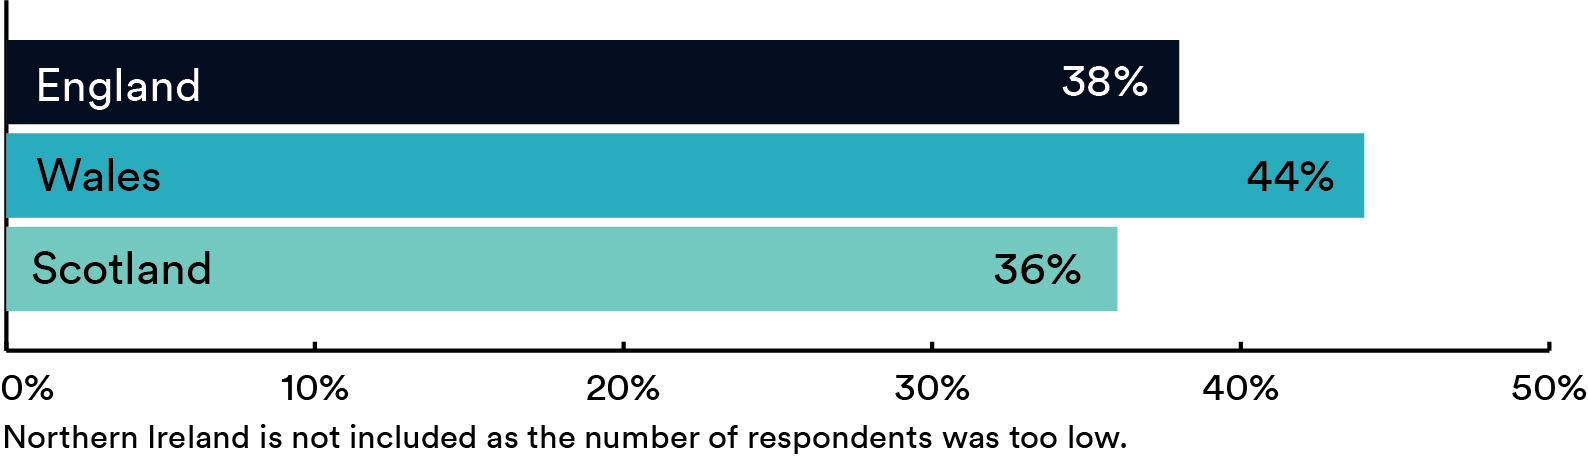
Patterns of divergence in satisfaction were evident between the UK’s nations. Wales was the most satisfied nation, with net satisfaction scores above the UK average in 10 of 17 surveyed areas. Scottish respondents, on the other hand, returned below-average satisfaction scores across the majority of public services, and were less likely to be satisfied with public services delivered by the UK Government compared to those administered by the Scottish Government. However, small sample sizes for both Wales and Scotland means data concerning these nations should be regarded with caution.
One candidate theory to explain the trends in our survey data is that those who use public services more often are more likely to be dissatisfied with them. Groups more likely to use or rely on public services, such as women, older people and those not in work, were less likely to be satisfied, and more likely to be dissatisfied, with the state of public services. Significantly, groups dependent on a particular service were shown to be less likely to be satisfied with its delivery: for instance, those not in work were significantly less satisfied and more dissatisfied than those in work with Social Security, Welfare & Job Support, while respondents aged 55-64 were considerably more likely to be dissatisfied than all other age groups with Social/Aged Care Services.
Furthermore, although we have made efforts to track public sentiments towards delivery of public services rather than policy, in some cases the two are likely to be inextricably linked in the eyes of citizens. For instance, Immigration & Asylum, a high-profile and controversial topic in British politics, had a net satisfaction score of just 26%, while net dissatisfaction stood 12 points above at 38%. Given that only a small minority of the UK population are likely to have experienced this public service first-hand, one may surmise that this is a service likely to be influenced by respondents’ political positions and pre-existing attitudes towards immigration levels and policy.
An identical study is being carried out in parallel in Australia. Comparing data from the two countries, it is clear that Australians are seemingly more satisfied with public services than their British counterparts.
This is not immediately obvious based on the responses for Public Services as a Whole, for which there was only a small divergence, with 46% of Australian respondents being net satisfied and 17% dissatisfied, versus 45% and 19% in the UK. If we take each service on a case by case basis, however, there is a clear-cut conclusion: Of the 17 categories polled, respondents in Australia were more satisfied with 14 areas of public services; the other three services – Waste & Refuse Management, Housing, and Schools – recorded the same net satisfaction ratings in both countries. On the other side of the coin, Australians were more net dissatisfied in just one public service, Social Security, Welfare, Job Support – and even in this instance, this was by just a single percentage point.
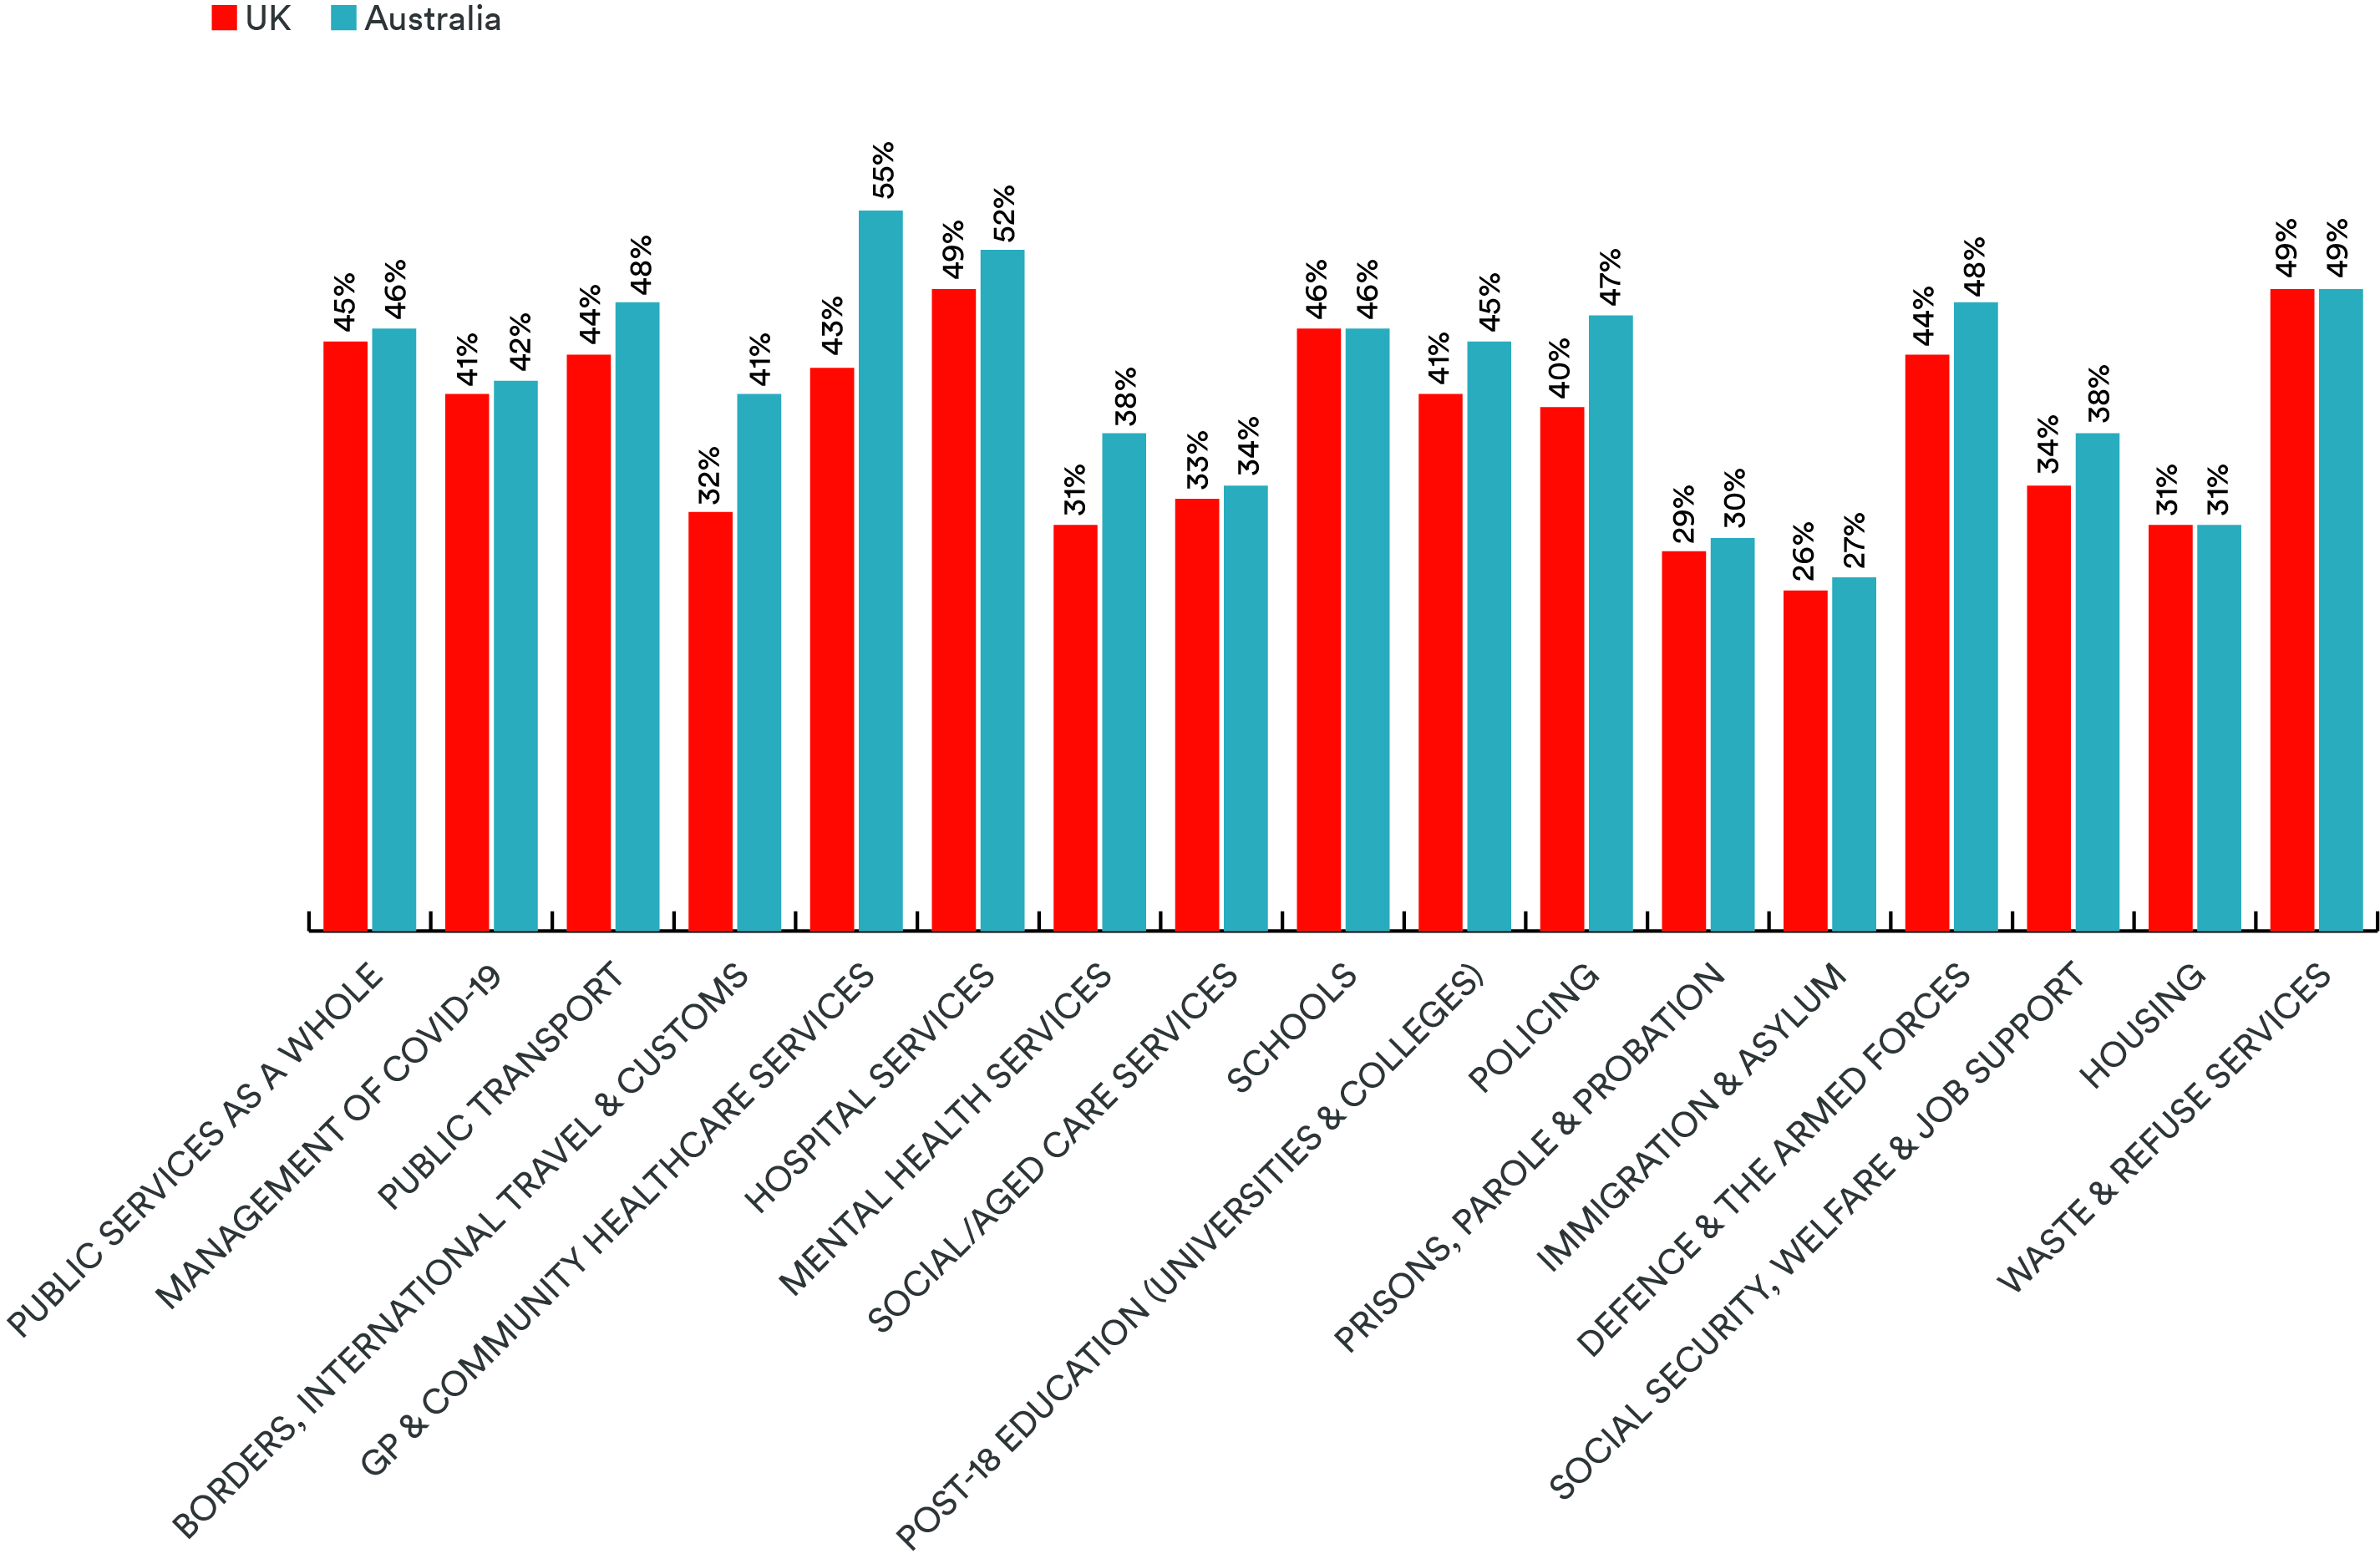
Across all 17 areas we polled, the UK public gave an (mean) average net satisfaction score of 39%, whereas the Australians returned an average figure 3 points higher at 42%. This slightly higher level of average satisfaction matches the pattern displayed in the mean dissatisfaction scores, where the UK’s responses came out 5 points higher at 26% as compared to the Australian figure of 21%. This is not to say that services are necessarily better. It could, for example, simply mean that Australians have different expectations of their public services.
While government is not just about pleasing everyone, in the future, the most successful governments will need to stay closer to their citizens, building a better two-way dialogue focussed on how to improve services and overcome newly emerging challenges. Central to this, is the idea of citizen-centred design of public services – creating services from the ground up, starting with the needs of the user, rather than what is convenient for the provider.
This new quarterly series from the Serco Institute - ‘People Powered Public Services: Monitoring UK Opinion’ - aims to make a small contribution to this new emerging era of public service design and delivery.
[1] Our findings are drawn from the results of an internet omnibus survey, conducted by Kantar between 26 and 30 August 2021, of 1,044 UK residents aged 16-64. The sample has been weighted to represent the adult population aged 16-64.