

In our ground-breaking new report, the Serco Institute finds that Australians are overwhelmingly satisfied with the public services that they use.
In this informative new project, we will track public sentiment towards 15 different areas of public service in Australia (and the UK), as well as ‘Public Services as a Whole’ and the ‘Management of Covid-19’. This will be done through a series of nationally representative surveys carried out quarterly by an independent polling company.
This first paper examines the public mood during a period of stringent Covid restrictions for half of Australia's population, and already many interesting trends are evident in the data[1].
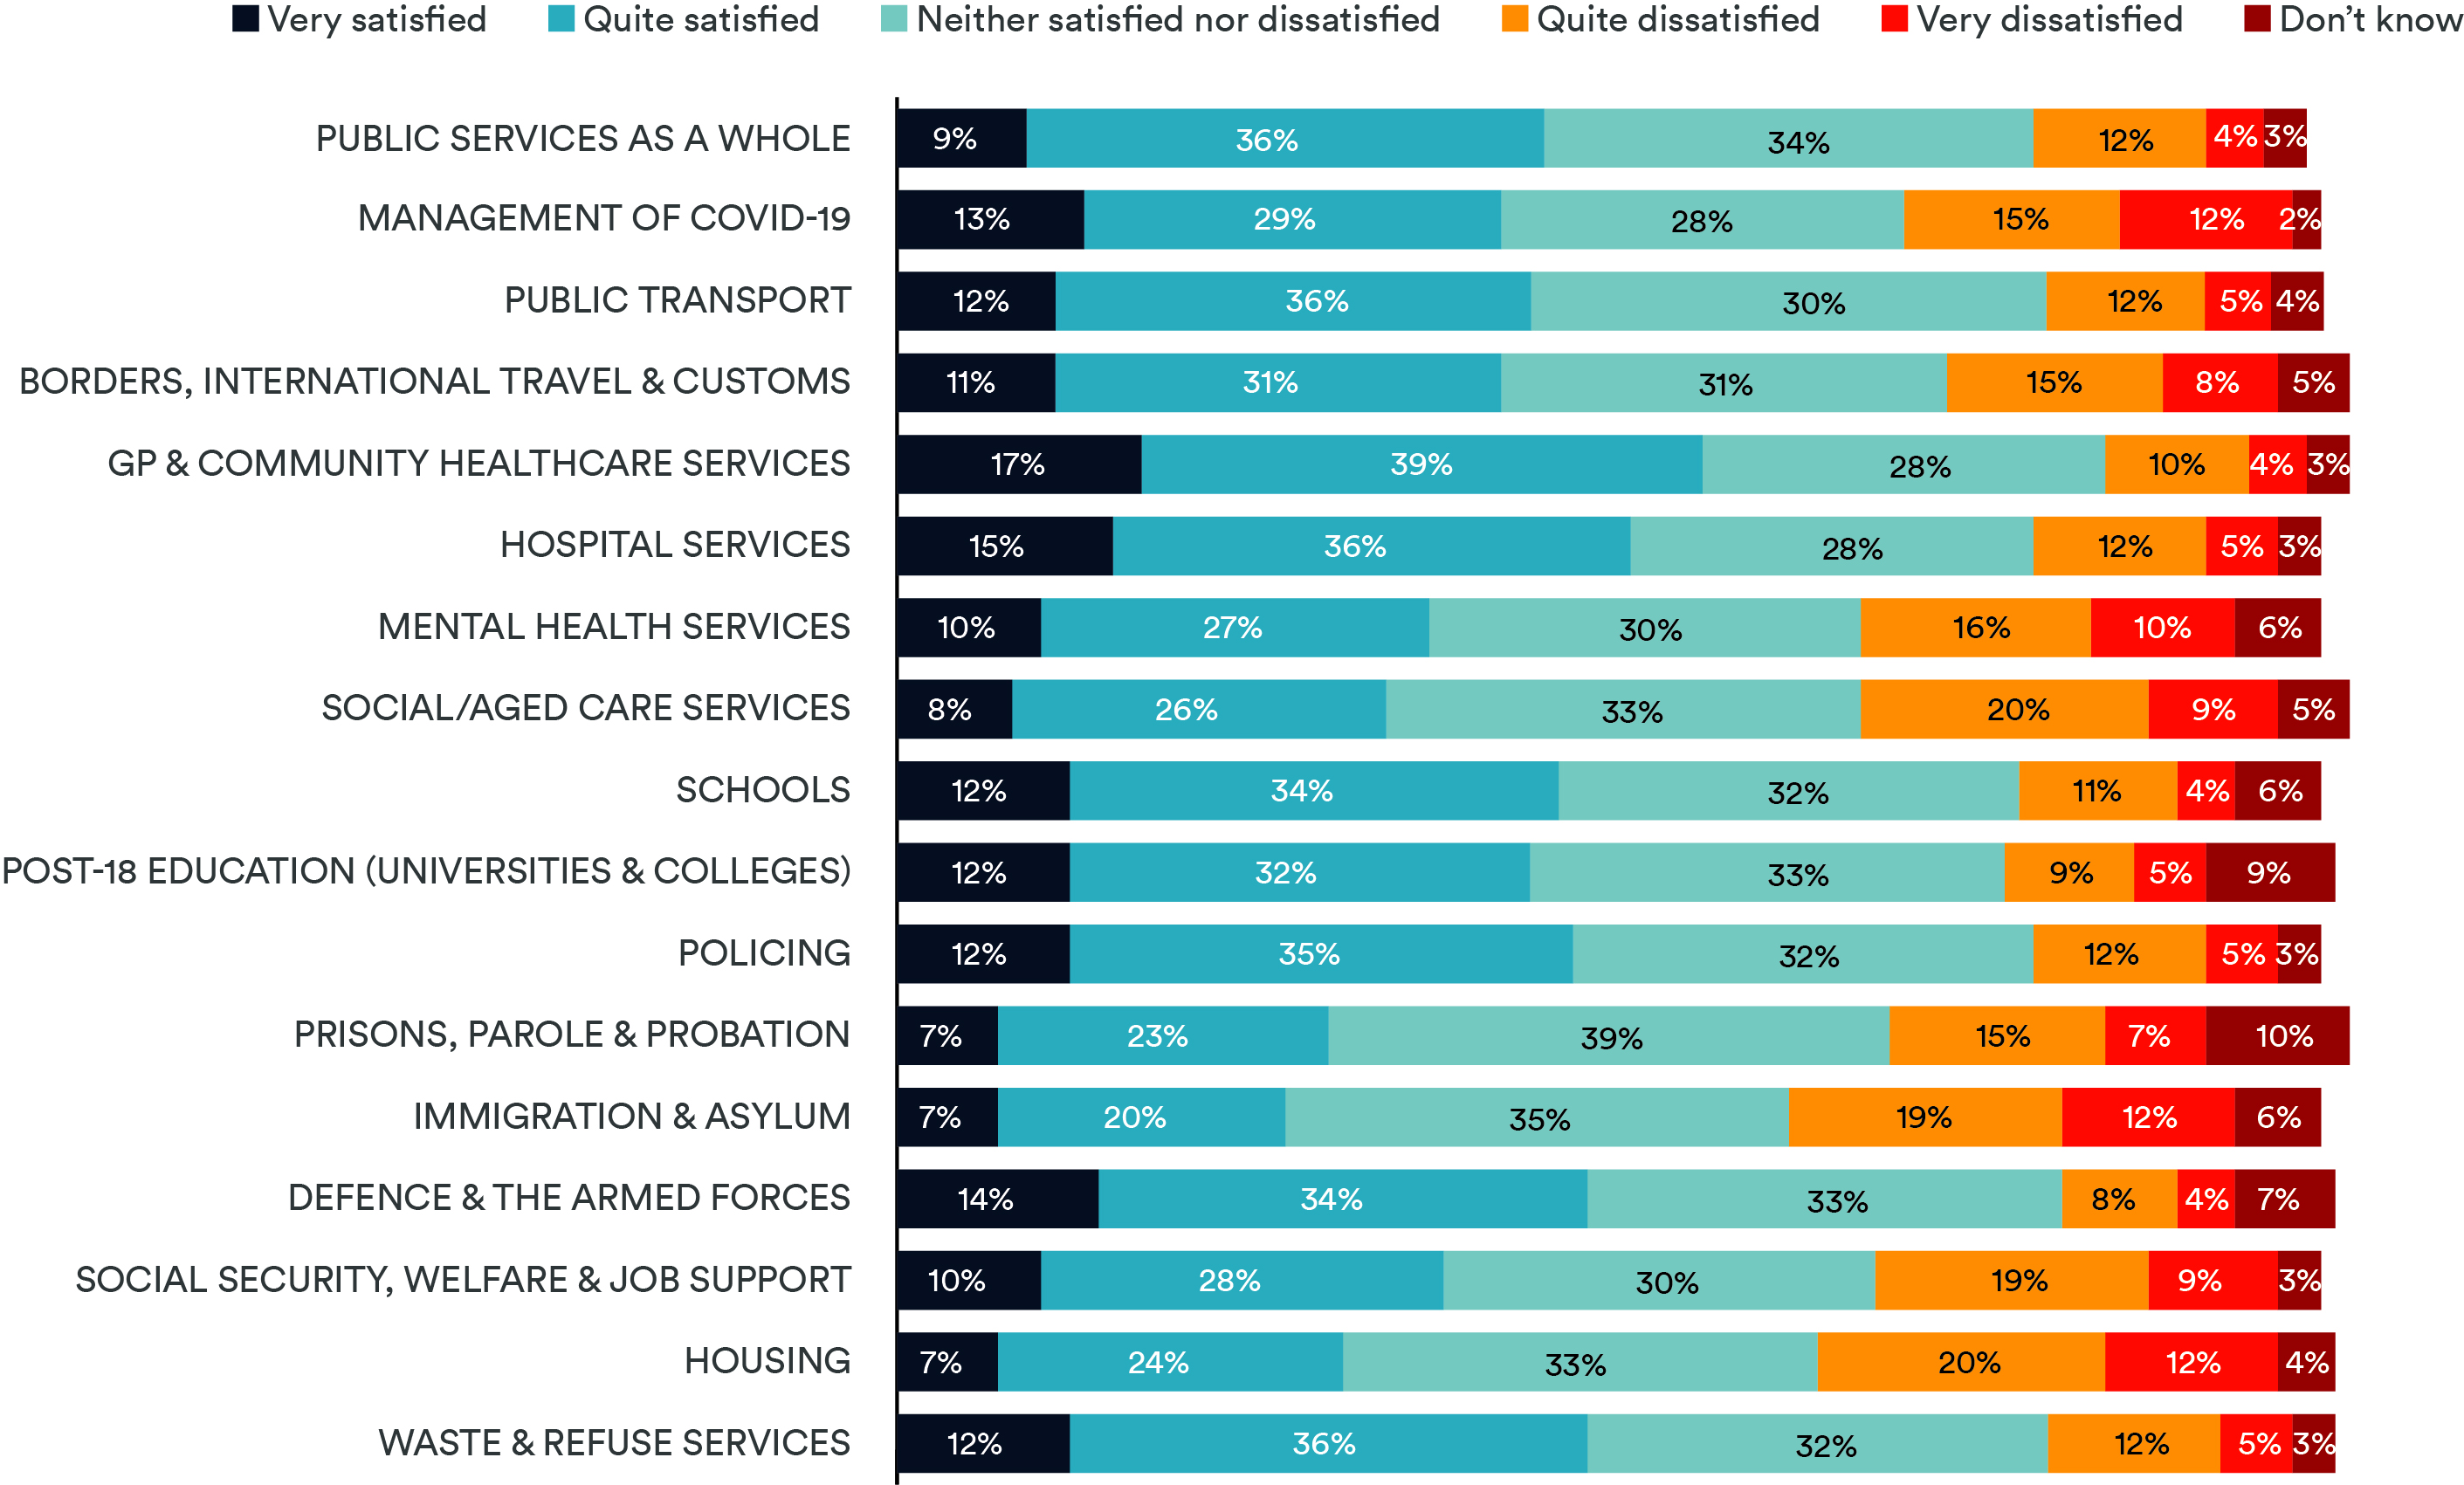
Covering everything from GP & Community Healthcare to Waste & Refuse Services, we sought to get the fullest possible picture of how people feel about public services.
Australians are generally very satisfied with public services, with 11 of the 17 polled categories receiving a net satisfaction score of over 40% despite the option to select ‘neither satisfied nor dissatisfied’. When asked to rate Public Services as a Whole, 46% of respondents stated they were ‘very’ or ‘quite satisfied’ (the net satisfaction score), outnumbering the 17% of respondents who said they were ‘very’ or ‘quite dissatisfied’ (the net dissatisfaction score) by nearly three to one. Furthermore, 34% of Australians, double the proportion of dissatisfied respondents, stated they were ‘neither satisfied nor dissatisfied’ with Public Services as a Whole – arguably, this indicates they find public services adequate.
The public service with which Australians were most satisfied was GP & Community Healthcare Services, earning a net satisfaction score of 55%, 41 percentage points above its net dissatisfaction score (14%). Other public services deemed very satisfactory by respondents include Hospital Services (52% net satisfaction, 18% net dissatisfaction); Waste & Refuse Service (49% net satisfaction, 16% net dissatisfaction); and Defence & the Armed Forces (48% net satisfaction, 12% net dissatisfaction).
Across 17 surveyed areas of public services, only two saw higher number of dissatisfied respondents than satisfied.
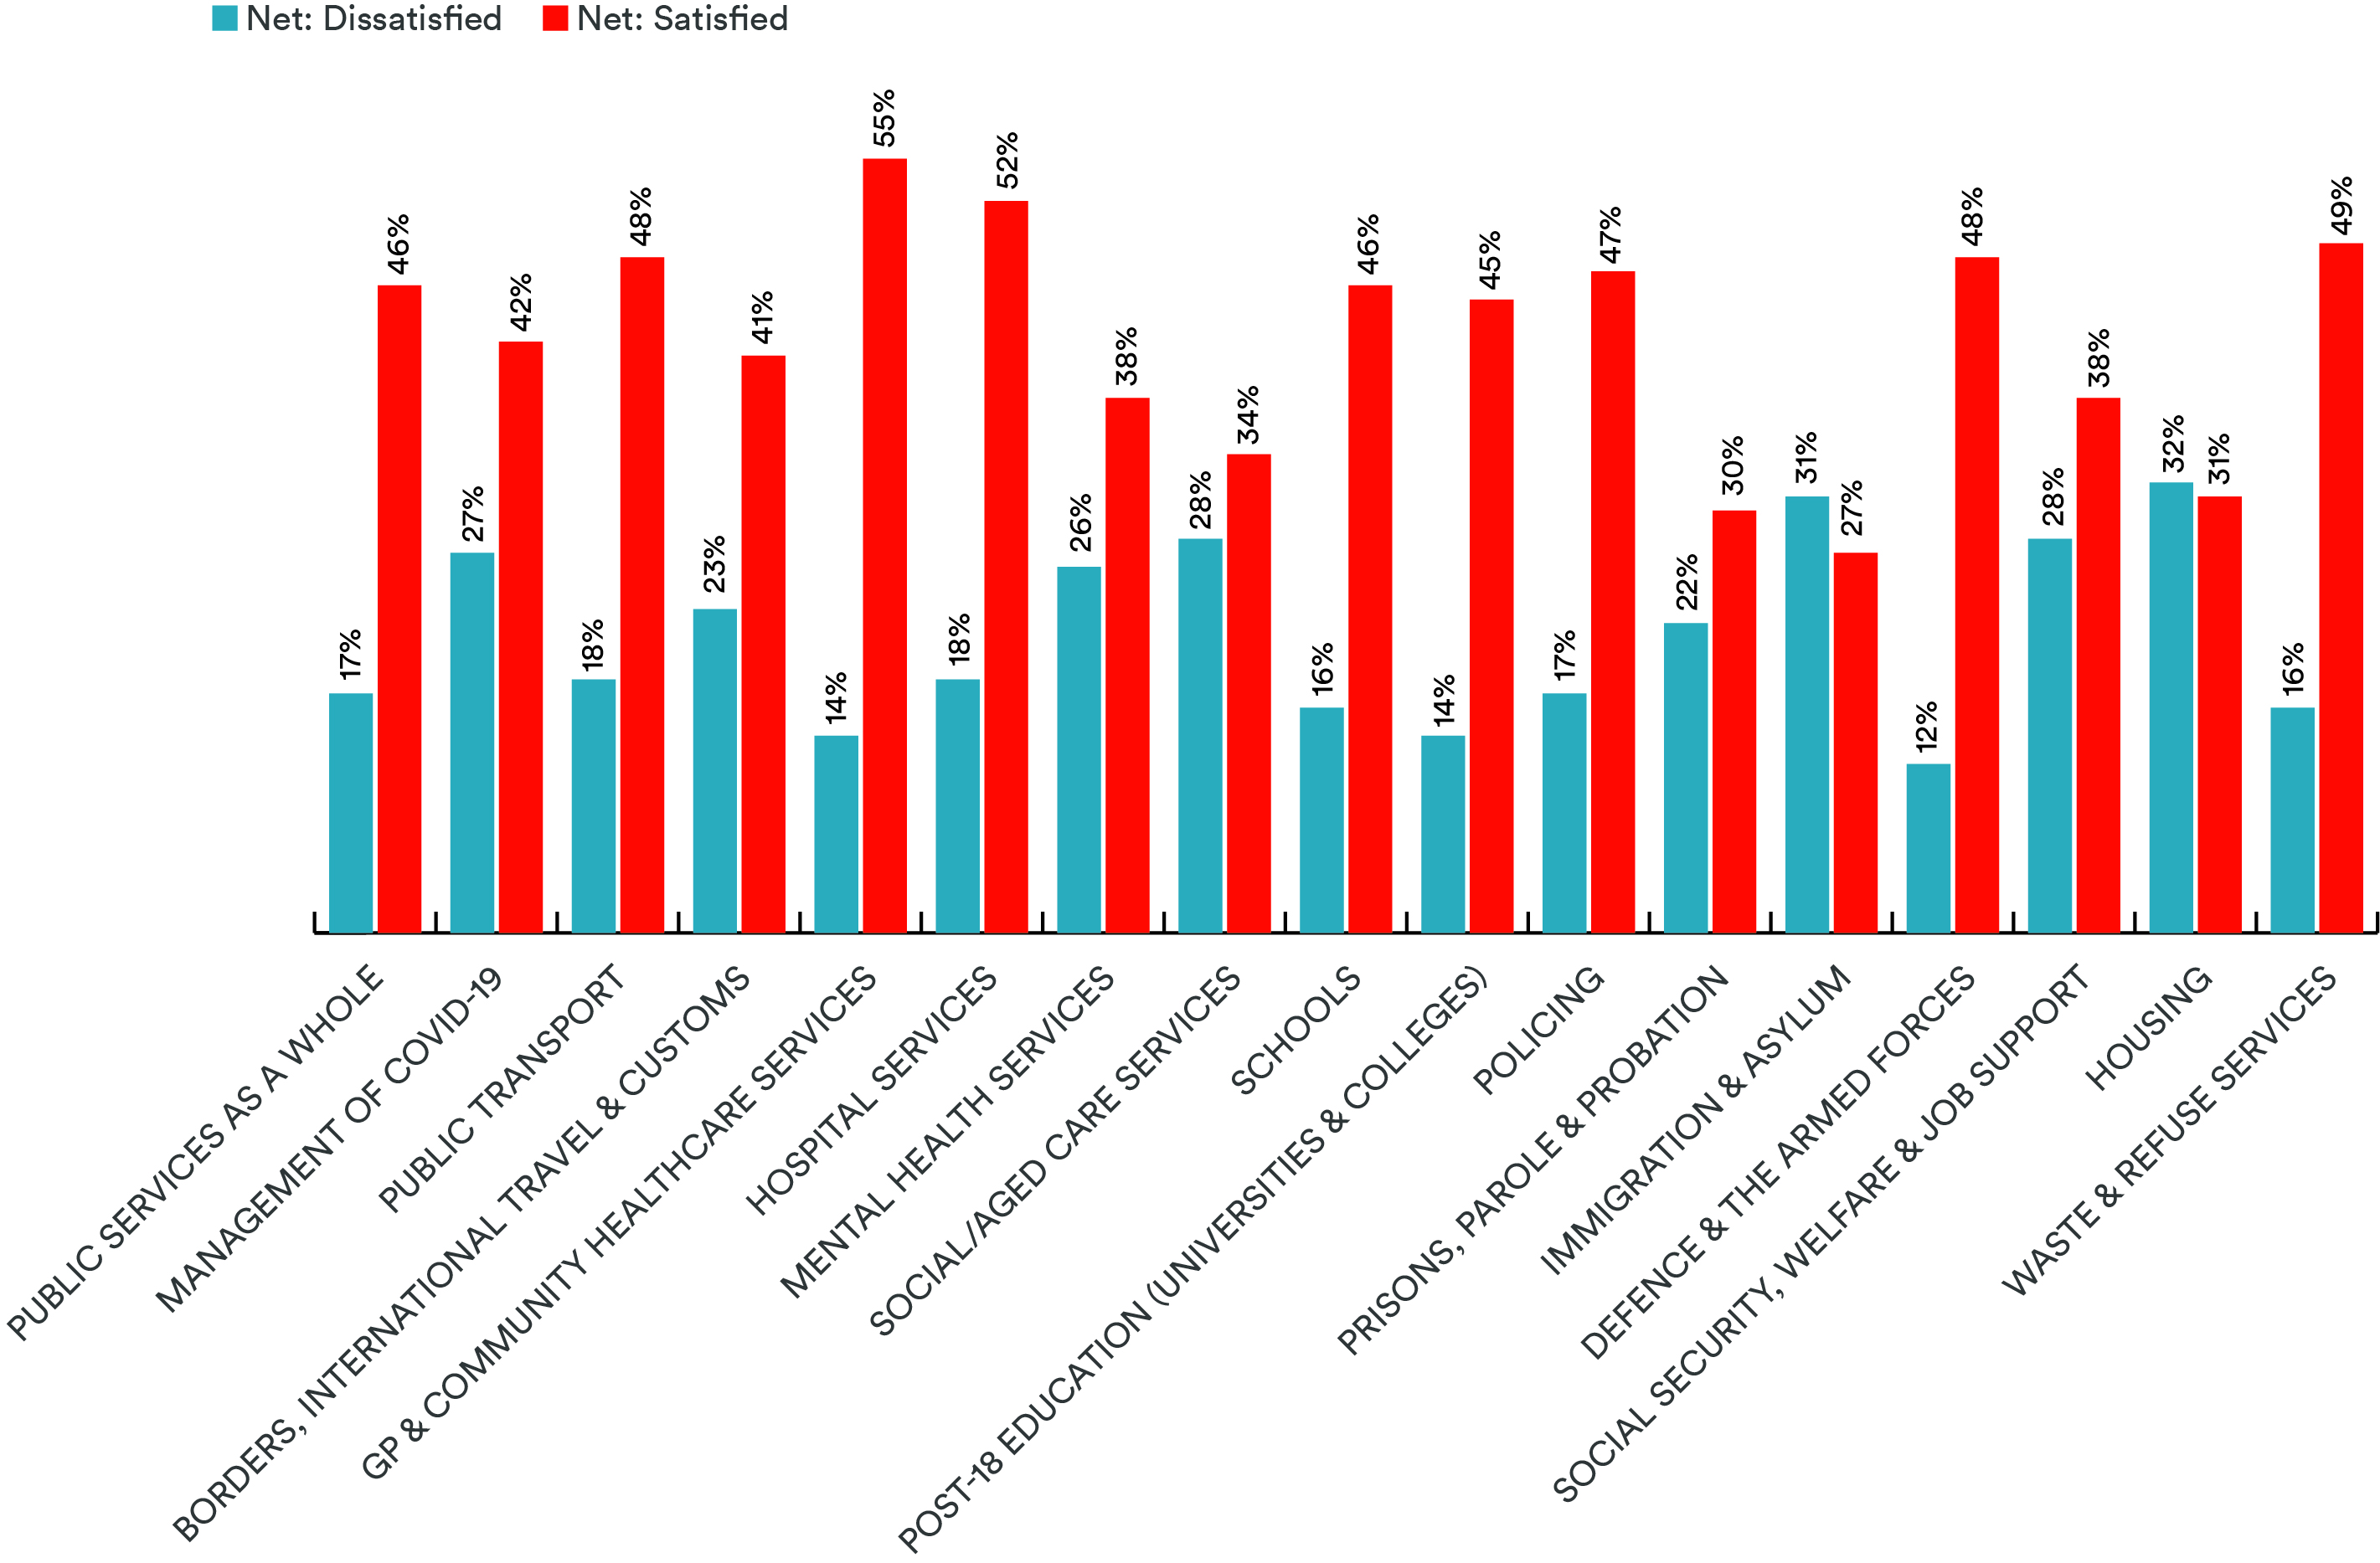
Housing was the public service with the highest net dissatisfaction score, at 32%, although this was notably only one percentage point above net satisfaction (31%). Australians were dissatisfied with Immigration & Asylum by a wider but still negligible margin, with dissatisfied respondents (31%) outnumbering satisfied ones (27%) by four points.
Clear patterns were evident in the survey data we collected, with demographic, socioeconomic and geographical factors contributing to variances in satisfaction and dissatisfaction levels with different public services.
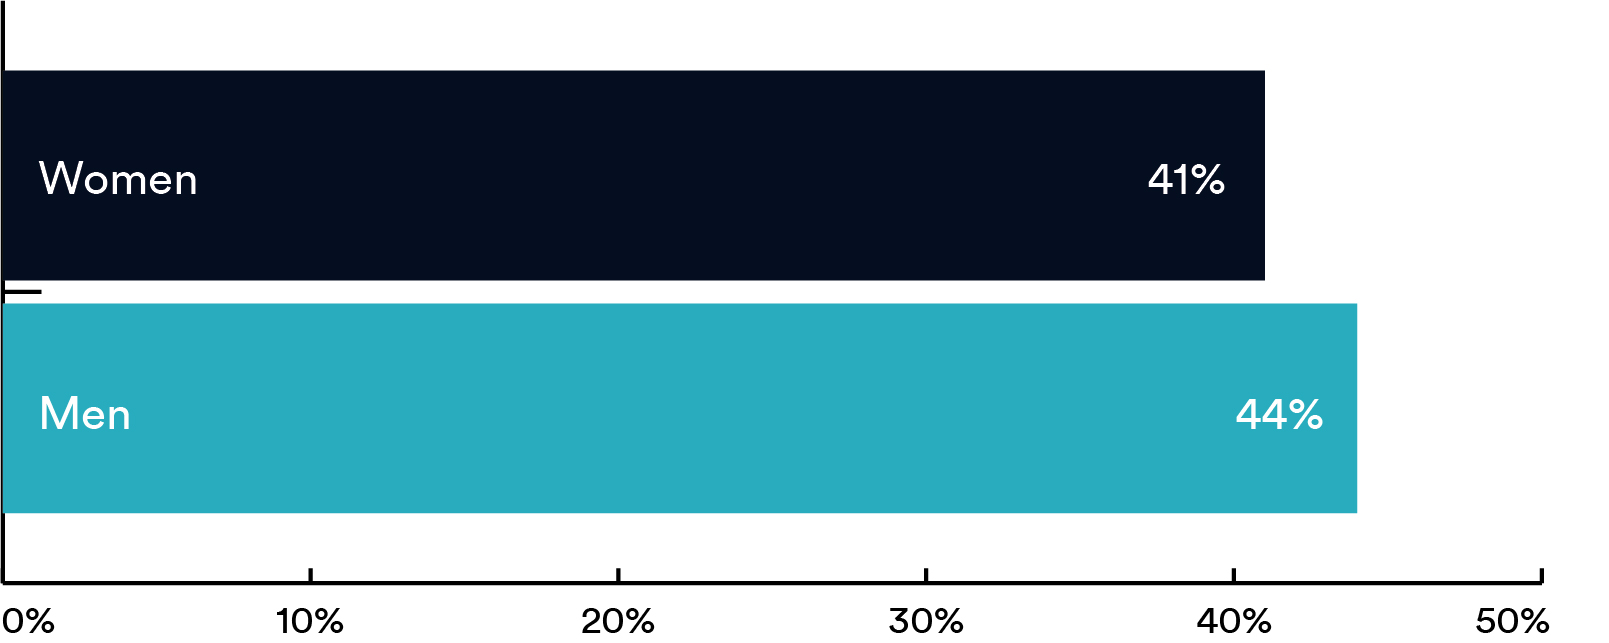
In 13 of 17 polled areas of public services, men returned higher net satisfaction scores than women. However, in many cases the gaps between satisfaction rates were insignificant, with only one percentage point separating men and women’s net satisfaction scores in several areas. Nevertheless, the consistency of men’s satisfaction being higher than that of women across the majority of surveyed areas suggests a slight inequity in Australian public services which should be examined more closely.
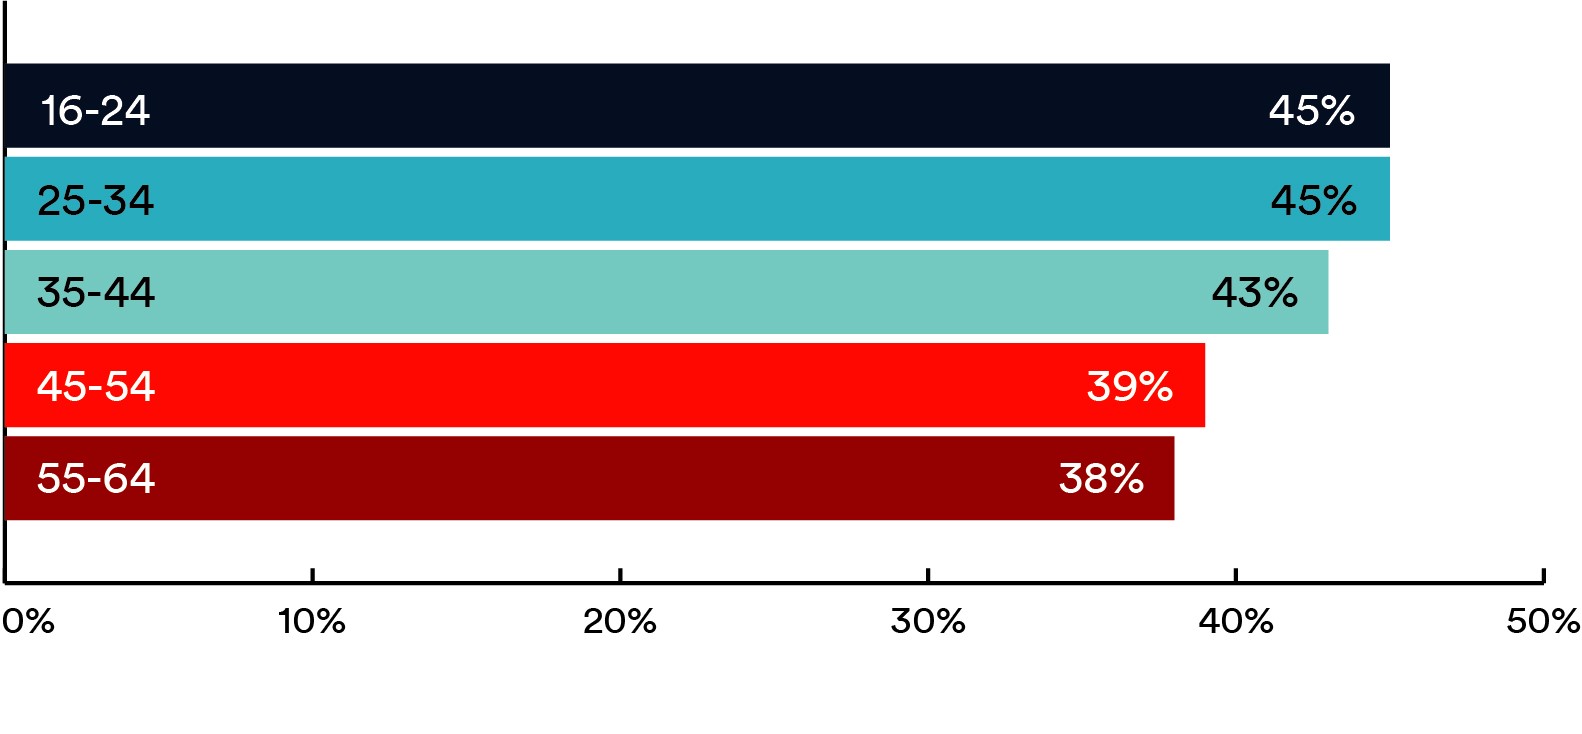
Age was a further determinant of satisfaction: with some exceptions, older age groups were considerably less likely to be satisfied than younger Australians, and in 12 of the 17 surveyed areas, the lowest net satisfaction score was returned by one of the two oldest age cohorts, 45-54-year-olds and 55-64-year-olds. The oldest age banding, 55-64, averaged a net satisfaction score of 38%, seven points below that of the two youngest groupings, 16-24-year-olds and 20-34-year-olds.
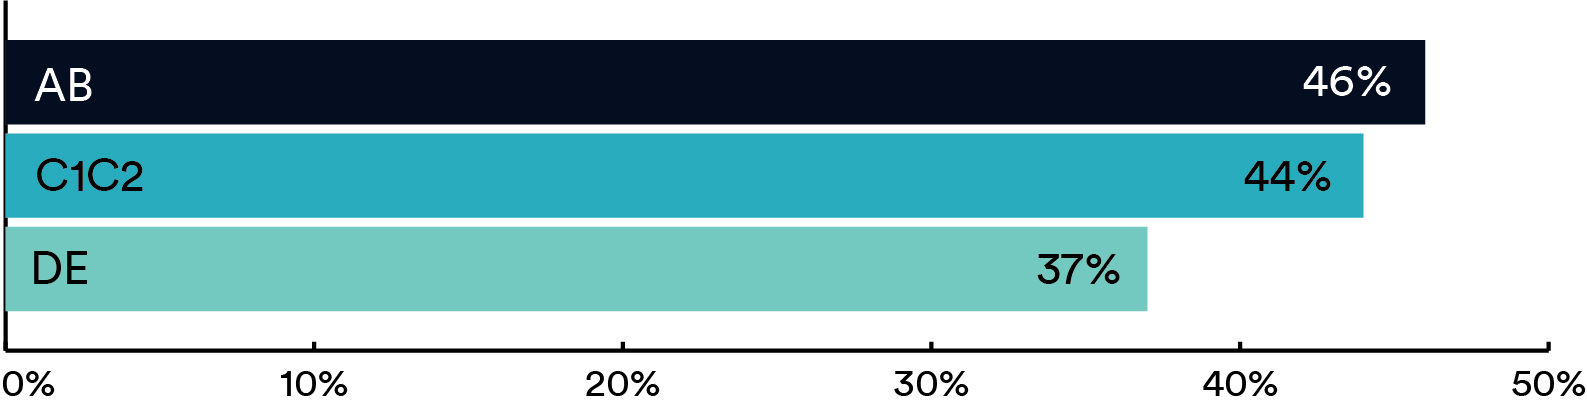
 Satisfaction and dissatisfaction with public services also depended on a respondent’s socioeconomic status. Those belonging to the highest grouping (AB) of ‘Social Grades’[2], generally professionals or those in senior managerial positions (or people in their household), returned higher net satisfaction scores than those in the lowest grouping (DE) across all 17 surveyed areas. AB respondents’ satisfaction scores were also higher than those respondents in the middle grouping (C1C2) in 12 of 17 polled areas, but in many cases these differences were small.
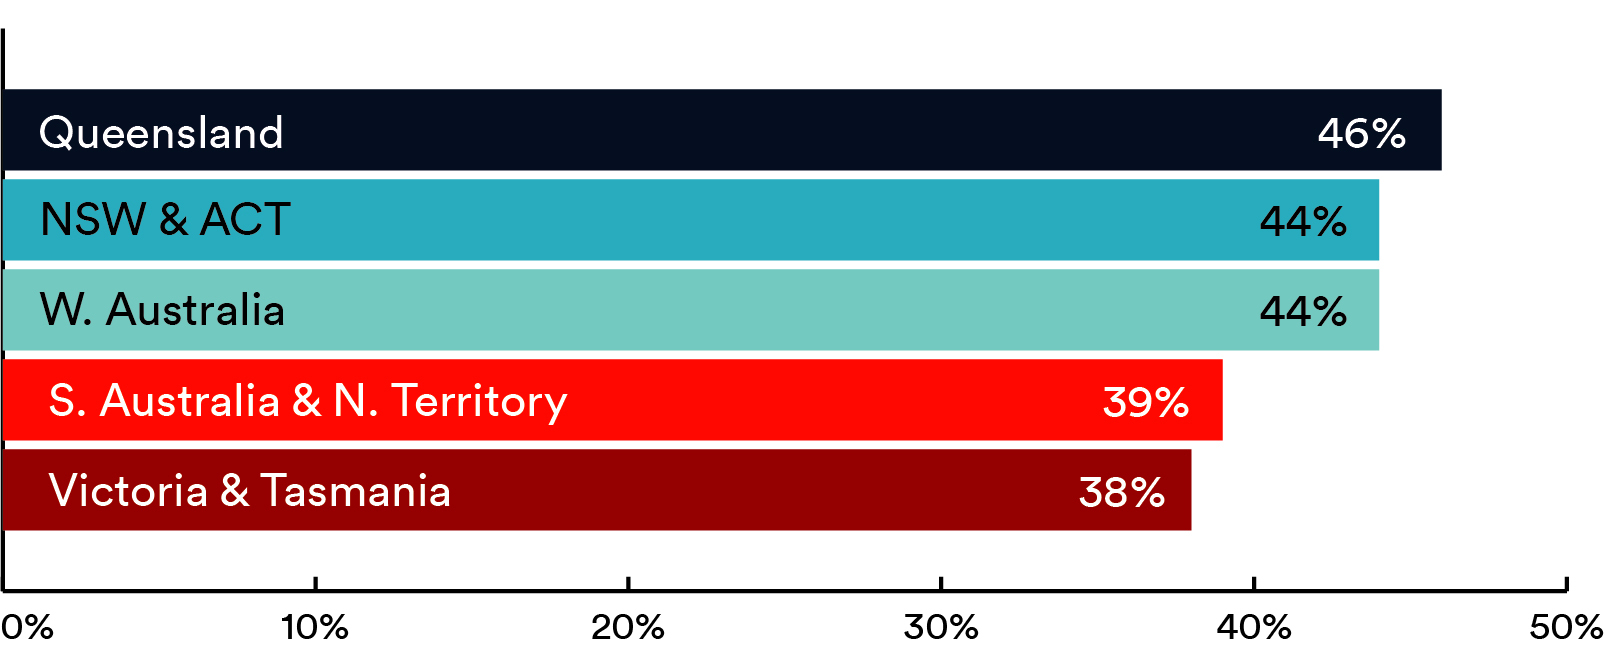
Many public services in Australia are delivered at the level of States and Territories, and indeed the breakdown of data into polling regions was one of the few areas in which sharp distinctions in satisfaction and dissatisfaction levels were to be noted. Unsurprisingly, given the ongoing outbreak of the Delta variant in Australia and the differing responses of the State Governments, the largest disparities between the regions were evident in Management of Covid-19. Respondents in regions with high transmission rates and strict Covid restrictions reported far lower satisfaction rates than those in regions with very low infection rates and little to no restrictions.
In analysing the trends found in our survey data, we theorise that public sentiments towards certain public services may be coloured by said services’ position as highly contentious issues within Australian politics. Given that it is unlikely that most respondents had prior experience of Immigration & Asylum, a controversial and divisive subject in Australian politics, before taking our survey, it may be inferred that the relatively high net dissatisfaction score, 31%, for this service is related to individual respondents’ political views and disposition towards immigration policy and asylum, and it was on this basis that many respondents made their assessment.
The ‘tangibility’ of a public service is likely, also, to play a role in how citizens feel about it: while Waste & Refuse Services does not excite political passions in the same vein as Immigration & Asylum, the vast majority of Australians will encounter waste management services on an extremely regular basis. Waste disposal is also an uncontroversial issue which does not require a sophisticated grasp of public policy to be understood. In this instance, user experience is likely to inform citizens’ judgment of public service performance.
Although not immediately obvious if the responses for Public Services as a Whole are considered in isolation – for which there was only a small divergence between the countries – this polling also identifies a difference between how citizens in Australia and the UK regard their country’s public services.
Looking at each service on a case by case basis there is a clear indication that Australians are more satisfied with public services than their British counterparts. This is perhaps best exemplified by two comparisons: Firstly, Australians returned a higher satisfaction and lower dissatisfaction score significantly more frequently than their British equivalents. Of the 17 categories polled, respondents in Australia were more satisfied with 14 areas of public services; the other three services – Waste & Refuse Services, Housing, and Schools – recorded the same net satisfaction ratings in both countries. On the other side of the coin, Australians were more net dissatisfied in just one public service, Social Security, Welfare & Job Support – and even in this instance, the differential was just a single percentage point.
Secondly, across all 17 areas we polled, the UK public gave an (mean) average net satisfaction score of 39%, whereas the Australians returned an average figure 3 points higher at 42%. This slightly higher-level of average satisfaction is somewhat affirmed by the mean dissatisfaction scores, where the UK’s scoring was 5 points higher at 26% as compared to the Australian figure of 21%.
The Australian public therefore seems to be consistently more pleased with the services they receive. This is not to say that services are necessarily better. It could, for example, simply mean that British expectations for public services are different to those of Australian citizens, or their outlook is generally more pessimistic.
While government is not just about pleasing everyone, in the future, the most successful governments will need to stay closer to their citizens, building a better two-way dialogue focussed on how to improve services and overcome newly emerging challenges. Central to this, is the idea of citizen-centred design of public services – creating services from the ground up, starting with the needs of the user, rather than what is convenient for the provider.
This new quarterly series from the Serco Institute - ‘People Powered Public Services - Monitoring Australian Opinion’ aims to make a small contribution to this new emerging era of public service design and delivery.
________________________
[1] Our findings are drawn from the results of an internet omnibus survey, conducted by Kantar between 26 and 30 August 2021, of 1,042 residents of Australia aged 16-64. The sample has been weighted to represent the adult population aged 16-64.
[2] As defined by the NRS Social Grading system.